グループ: Randox

カタログの抜粋
INTERLABORATORY DATA MANAGEMENT
カタログの1ページ目を開く
ACUSERA 24•7 ONLINE QC SOFTWARE WITH REAL-TIME PEER GROUP STATISTICS
カタログの2ページ目を開く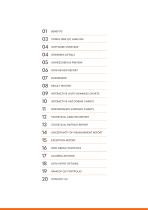
STRESS FREE QC ANALYSIS SOFTWARE OVERVIEW ORDERING DETAILS HOMESCREEN & PREVIEW DATA REVIEW REPORT RESULT HISTORY INTERACTIVE LEVEY-JENNINGS CHARTS INTERACTIVE HISTOGRAM CHARTS PERFORMANCE SUMMARY CHARTS STATISTICAL ANALYSIS REPORT STATISTICAL METRICS REPORT UNCERTAINTY OF MEASUREMENT REPORT EXCEPTION REPORT PEER GROUP STATISTICS ACUSERA ADVISOR DATA ENTRY OPTIONS
カタログの3ページ目を開く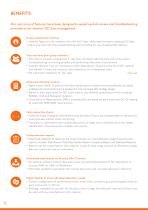
BENEFITS Our vast array of features have been designed to speed up data review and troubleshooting procedures for smarter QC data management. Unique dashboard interface • Instantly flags any rule violations from the last 7 days, reducing time spent analysing QC data. • Warns you when QC lots are approaching expiry, avoiding the use of expired QC material. True real-time peer group statistics * • Peer data is uniquely updated live in real-time ultimately reducing time and money spent troubleshooting, re-running samples and performing instrument maintenance. • Instantly discover how you...
カタログの4ページ目を開く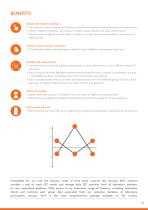
BENEFITS Simple and intuitive interface • The software is fast, powerful and easy to use, therefore delivering an enhanced user experience. • Colour coded throughout, providing an instant visual indication of poor performance. • Simple assay configuration with ability to share a configuration across multiple instruments or affiliated labs. Online access anytime, anywhere • Cloud based software, eliminating the need for local installation and frequent back ups. Multiple lab management • Compare performance to a global peer group or other laboratories in your affiliate network in real-time. •...
カタログの5ページ目を開く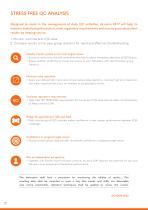
STRESS FREE QC ANALYSIS Designed to assist in the management of daily QC activities, Acusera 24•7 will help to improve analytical performance, meet regulatory requirements and ensure accurate patient results by helping you to; 1. Monitor and interpret IQC data 2. Compare results to live peer group statistics for rapid and effective troubleshooting Identify trends, system errors and reagent issues • A ccess to interactive charts & comprehensive reports allows immediate detection of QC failures. • Assess whether performance issues are unique to your laboratory with real-time peer group...
カタログの6ページ目を開く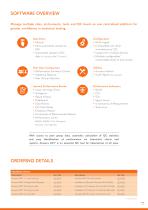
SOFTWARE OVERVIEW Manage multiple sites, instruments, tests and QC levels on one centralised platform for greater confidence in analytical testing. Data Entry • Manual • Semi-automated upload via EDI • Automated upload of QC data (via Acusera 24•7 Connect) Configuration • Multi-lingual • Compatible with other manufacturers’ QC • Support for multiple devices • Multiple configurable/ customisable levels of user access Peer Data Comparison • Performance Summary Charts • Statistical Reports • Peer Group Statistics Utilities • Acusera Advisor • Audit Report (by request) Internal Performance...
カタログの7ページ目を開く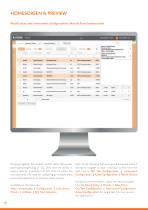
HOMESCREEN & PREVIEW Recall assay and instrument configurations directly from homescreen Bringing together the creation of QC tests, QC panels, opening/closing/hiding of QC tests and the ability to export data for a selection of QC tests all within the one base area. No need for navigating to multiple areas within the application to perform these actions. Available via Homescreen: Filter Functionality | Configuration | Data Entry Charts | Utilities | QC Test Selection Each of the following features can be accessed without having to navigate to each individual screen from the side menus: QC...
カタログの8ページ目を開く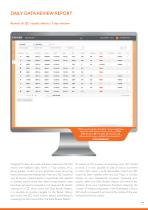
DAILY DATA REVIEW REPORT Review all QC results within a 7-day window “QC Levey-Jennings chart daily review would have taken the staff approx 2 hours to do on LIMS. With Acusera 24•7 it takes 20 minutes and allows you to review multiple lots at one time.” USER FEEDBACK Designed to allow for quick and easy reviewing of all QC results and violations daily within a 7 day window, thus, giving greater control of any potential issues occurring before they become widespread. Filter your QC results to view all results, violated results or specifically the rejected or alerted results whilst also...
カタログの9ページ目を開く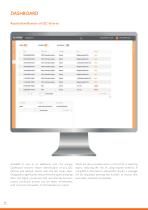
DASHBOARD Rapid identification of QC failures Available to you at no additional cost, the unique Dashboard ensures instant identification of any QC failures and alerted results over the last seven days. Designed to significantly reduce the time spent analysing data, this highly convenient and user-friendly function means corrective actions can be taken immediately, with minimum disruption to the laboratory’s output. Alerts are also provided when a control lot is reaching expiry, reducing the risk of using expired material. If using EDI or Connect to upload QC results, a message will be...
カタログの10ページ目を開く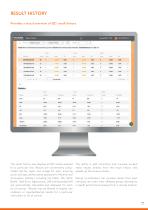
RESULT HISTORY Provides a visual overview of QC result history The result history view displays all QC results entered for a particular test. Results are conveniently colour coded red for reject and orange for alert, ensuring quick and easy performance assessment. Monthly and Cumulative statistics including the Mean, SD, %CV, Bias%, Total Error, Sigma score, UM and Expanded UM are automatically calculated and displayed for each lot of control. Results may be filtered to display rule violations or rejected/alerted results for a particular instrument or lot of control. The ability to add...
カタログの11ページ目を開く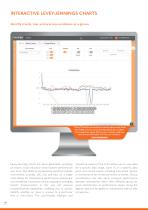
INTERACTIVE LEVEY-JENNINGS CHARTS Identify trends, bias and precision problems at-a-glance “Every 2 months we would have had to take screen shots from LIMS of every Levey-Jennings Chart per analyser. This would have taken 24 hours per analyser. And now with Acusera this takes us 1 hour per analyser.” USER FEEDBACK Levey-Jennings charts are easily generated, providing an instant, visual indication of test system performance over time. The ability to conveniently combine multiple instruments, analytes, QC lots and labs on a single chart allows for comparative performance assessment and...
カタログの12ページ目を開くRandox Laboratories/ランドックスのすべてのカタログと技術パンフレット
-
 LT735 Vivalytic Overview
32 ページ
-
 Acusera New Controls
8 ページ
-
 Acusera Third Party Controls
108 ページ
-
 Acusera SMART Controls
12 ページ
-
 Company Overview
40 ページ
-
 Reagents Brochure
64 ページ
-
 sdLDL-C
8 ページ
-
 RX modena
20 ページ
-
 RX misano
20 ページ
-
 RX Daytona Plus
20 ページ
-
 Rx Imola
20 ページ
-
 RX Monaco
20 ページ
-
 2024 Product List
64 ページ
-
 VeraSTAT-V
16 ページ
-
 LT033 RIQAS Explained
64 ページ
-
 VERASTAT
16 ページ
-
 Endocrine Array
4 ページ
-
 Cerebral Arrays
4 ページ
-
 Thyroid Arrays
4 ページ
-
 Basic QC Stastics
8 ページ
-
 Commutability Guide
4 ページ
-
 Qnostics
52 ページ
-
 Adiponectin LT519
28 ページ
-
 Specific Proteins
40 ページ
-
 Linearity sets
12 ページ
-
 Antioxidants
16 ページ
-
 Diabetes Portfolio
28 ページ
-
 Total Bile Acids
4 ページ
-
 VIVALYTIC
30 ページ
-
 RANDOX DISCOVERY
36 ページ
-
 HbA1c
HbA1c2 ページ
-
 Preparing QC
1 ページ
-
 Point of Care Testing
12 ページ
-
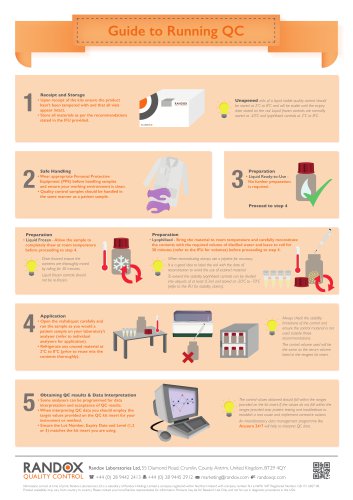 Guide to running QC
1 ページ
-
 Tumour Marker Arrays
4 ページ
-
 LT169 Cardiac Array
4 ページ


カタログアーカイブ
-
 ACUSERA
108 ページ
-
 Evidence Evolution
28 ページ
-
 Evidence
16 ページ
-
 STI Multiplex Array
8 ページ
-
 Molecular Testing
16 ページ
-
 Evidence Investigator
20 ページ
-
 Fertility Array
4 ページ
-
 Rx Daytona
16 ページ
-
 Evidence Investigator
16 ページ
-
 Evidence
16 ページ

