Scientific article
1 /12Pages
Scientific article
1 /12Pages
Catalog excerpts

Original Article In vivo imaging of synaptic SV2A protein density in healthy and striatal-lesioned rats with [11C]UCB-J PET Journal of Cerebral Blood Flow & Metabolism 0(0) 1–12 ! The Author(s) 2020 Article reuse guidelines: sagepub.com/journals-permissions DOI: 10.1177/0271678X20931140 journals.sagepub.com/home/jcbfm Majken B Thomsen1,2, Jan Jacobsen1, Thea P Lillethorup1 , Anna C Schacht1, Mette Simonsen1, Marina Romero-Ramos2, David J Brooks1,3 and Anne M Landau1,4 Abstract The number of functionally active synapses provides a measure of neural integrity, with reductions observed in neurodegenerative disorders. [11C]UCB-J binds to synaptic vesicle 2A (SV2A) transmembrane protein located in secretory vesicles. We aimed to assess [11C]UCB-J PET as an in vivo biomarker of regional cerebral synaptic SV2A density in rat lesion models of neurodegeneration. Healthy anesthetized rats had [11C]UCB-J PET and arterial blood sampling. We compared different models describing [11C]UCB-J brain uptake kinetics to determine its regional distribution. Blocking studies were performed with levetiracetam (LEV), an antiepileptic SV2A antagonist. Tracer binding was measured in rodent unilateral acute lesion models of Parkinsonism and Huntington’s disease, induced with 6-hydroxydopamine (6OHDA) and quinolinic acid (QA), respectively. [3H]UCB-J autoradiography was performed in postmortem tissue. Rat brain showed high and fast [11C]UCB-J uptake and washout with up to 80% blockade by LEV. [11C]UCB-J PET showed a 6.2% decrease in ipsilateral striatal SV2A binding after 6-OHDA and 39.3% and 55.1% decreases after moderate and high dose QA confirmed by autoradiography. In conclusion, [11C]UCB-J PET provides a good in vivo marker of synaptic SV2A density which can potentially be followed longitudinally along with synaptic responses to putative neuroprotective agents in models of neurodegeneration. Keywords [11C]UCB-J PET, SV2A protein, neurodegeneration, synapse, rat Received 29 January 2020; Revised 30 April 2020; Accepted 5 May 2020 Introduction The chemical synapse is the major locus for direct communication between neurons. The presynaptic terminal contains vesicles with neurotransmitters that can be released into the synaptic cleft, act on postsynaptic receptors and then be taken up by terminal and vesicle transporters which play an essential role in synaptic plasticity. Presynaptic dysfunction occurs in neurodegenerative diseases including Parkinson’s,1 2 3 Alzheimer’s and Huntington’s disease causing both impaired motor and cognitive function. The recently developed PET tracer [11C]UCB-J binds to the synaptic vesicle glycoprotein 2A (SV2A), a transmembrane protein expressed ubiquitously and located in presynaptic vesicles throughout the brain.4,5 SV2A plays an important role in synaptic 1 Department of Nuclear Medicine and PET Center, Department of Clinical Medicine, Aarhus University, Aarhus, Denmark 2 Department of Biomedicine, Aarhus University, Aarhus, Denmark 3 Translational and Clinical Research Institute, Newcastle upon Tyne University, Newcastle upon Tyne, UK 4 Translational Neuropsychiatry Unit, Department of Clinical Medicine, Aarhus University, Aarhus, Denmark Corresponding author: Anne M Landau, Department of Nuclear Medicine and PET Center and Translational Neuropsychiatry Unit, Department of Clinical Medicine, Aarhus University, Palle Juul-Jensens Boulevard 165, J320, Aarhus N 8200, Denmark. Email: alandau@cli
Open the catalog to page 1
2 vesicle function and [11C]UCB-J PET has been suggested to provide an in vivo marker of synaptic density and presynaptic integrity. Earlier studies of synaptic density have relied on postmortem methods where biopsies were used to quantify the synapses using synaptophysin histology, electron microscopy or Western blotting.6 The use of [11C]UCB-J PET allows the in vivo study of synaptic SV2A density in living individuals that can be applied when diagnosing active disease and monitoring progression. The cerebral uptake and binding properties of [11C] UCB-J have been investigated in monkeys, humans...
Open the catalog to page 2
spécifie activity = 137.8 ± 86 GBq/pmol, injected activity = 31.4 ± 7.8 MBq and injected mass = 0.14 ± 0.10 pg). There were no differences in injected activity, volume, mass or specific activity between rats scanned at baseline and those scanned after blocking with LEV. Rats were placed prone in a plastic stereotaxic frame designed to fit in the gantry of the microPET (nanoscan microPET/1 T MRI, Mediso Ltd., Budapest, Hungary) and imaged for 90 min. During imaging, body temper-ature was kept at 36-36.5°C using integrated hot-air channels in the chamber wall. Blood curves Arterial blood sampling...
Open the catalog to page 3
4 Journal of Cerebral Blood Flow & Metabolism 0(0) stored on ice and protected against light. The quino-linic acid solution (20 pg/4 pL or 40 pg/8 pL) was pre-pared according to Lelos et al.18 Rats were anaesthetized (1.8 mL per rat i.p of a mixture of 0.8 mL Cepetor and 10 mL Fentanyl-Hameln), and placed in a stereotaxic frame after shaving their scalp. A cut was made and a small hole was drilled in the scalp for the intrastriatal injections. The Hamilton syringe cannula tips were sited at the appropriate coor-dinates (6-OHDA; AP: 1, MC: -3 and DV: -4.9; QA (20 pg) AP: 1, MC: -3 and DV: -4.8;...
Open the catalog to page 4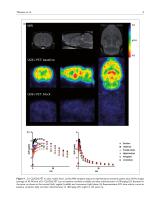
Figure 1. [11C]UCB-J PET in naıve rodent brain. (a) Rat MRI template (top) and representative standard uptake value (SUV) images ¨ (average of 30–90 min) of [11C]UCB-J PET scan at baseline condition (middle) and after administration of 100 mg/kg LEV (bottom) in the same rat shown at the coronal (left), sagittal (middle) and transverse (right) plane. (b) Representative SUV time activity curves at baseline condition (left) and after administration of 100 mg/kg LEV (right) in the same rat
Open the catalog to page 5
6 Journal of Cerebral Blood Flow & Metabolism 0(0) Table 1. [IIC]UCB-J PET imaging kinetics of the 1- and 2-tissue compartment models in na'ive rats. Note: Mean values of volume of distribution (VT), standard error (SE) of VT> Akaike information criterion (AIC), Kl and linear regression values from correlations between VTestimated using the I- or 2TCM (see the corresponding graphs in Supplemental Figure I). N = 8. UCB-J blockade LEV was used to block [11C]UCB-J binding. VND and occupancies were estimated with the occupancy plot (Figure 2) using 10mg/kg (n = 1), 40mg/kg (n = 1) and 100mg/kg (n...
Open the catalog to page 6