- Catalogs
- Applied Spectral Imaging
- FISH Capture & Analysis
FISH Capture & Analysis
1 /2Pages

FISH Capture & Analysis
1 /2Pages
Catalog excerpts
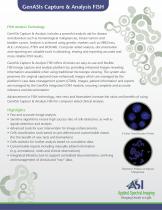
GenASIs Capture & Analysis FISH FISH Analysis Technology GenASIs Capture & Analysis includes a powerful analytic aid for disease and disorders such as hematological malignancies, breast tumors and bladder cancer. Analysis is achieved using genetic markers such as HER2/neu, ALK, UroVysion, PTEN and BCR/ABL. Computer aided analysis, documentation and reporting are valuable tools in obtaining, sharing and reporting accurate and more reliable FISH results. GenASIs Capture & Analysis FISH offers clinicians an easy-to-use and flexible FISH image capture and analysis platform by providing enhanced images revealing information unavailable when using traditional microscope viewing. The system also preserves the original captured (non-enhanced) images which are managed by the platform’s case data management system (CDM). Images, patient information and reports are managed by the GenASIs integrated CDM module, ensuring complete and accurate reference and documentation. Advancement in FISH technology, new tests and biomarkers increase the value and benefits of using GenASIs Capture & Analysis FISH for computer aided clinical analysis. Highlights • Fast and accurate image analysis • Sensitive algorithms ensure high success rate of cells detection, as well as signals detection and analysis • Advanced tools for user intervention for image enhancements. • Cells classification tools based on pre-defined and customizable classes (for the benefit of new tests and biomarkers) • Cells statistics for further analysis based on cumulative data. • Customizable reports including manually added information (e.g. annotations, notes and clinical observations) • Integrated infrastructure to support centralized documentation, archiving and management of clinical and “raw” data.
Open the catalog to page 1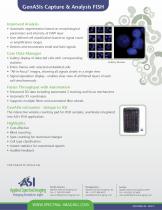
GenASIs Capture & Analysis FISH Improved Analysis • Automatic segmentation based on morphological parameters and intensity of DAPI layer • User defined cell classification based on signal count or amplification ranges • Detects and enumerates small and faint signals Case Data Manager • Gallery display of detected cells with corresponding statistics Gallery Review • Entire frames with selected embedded cells • "All-in-Focus" images, showing all signals clearly in a single view • Signal separation display - enables clear view of all filtered layers of each cell simultaneously Faster Throughput...
Open the catalog to page 2All Applied Spectral Imaging catalogs and technical brochures
 Karyotyping
2 Pages
 HiSKY
HiSKY2 Pages
 HIPath
2 Pages
 HER2/neu
2 Pages
 CTC
CTC2 Pages
 CDM
CDM2 Pages
 ALK
ALK2 Pages
 Case Data Manager
2 Pages
 GenASIs HyperSpectral
16 Pages
 GenASIs Cytogenetics Suite
8 Pages
 GenASIs Pathology Suite
12 Pages
 GenASIs Platforms
2 Pages

- Cell imaging system
- Automatic cell imaging system
- Laboratory cell imaging system
- Fluorescence cell imaging system
- Research cell imaging system
- Diagnostic cell imaging system
- Confocal cell imaging system
- Molecular biology cell imaging system
- Tissue cell imaging system
- 3D cell imaging system
- Clinical cell imaging system
- Histopathology cell imaging system
- FISH cell imaging system