- Catalogs
- Applied Spectral Imaging
- GenASIs HyperSpectral
GenASIs HyperSpectral

GenASIs HyperSpectral
GenASIs offers scalable and modular platforms tailored for laboratories of varying sizes. These platforms range from single-slide stations to high-capacity scanning stations, with options for additional workstations and servers. The Capture & Analysis platform supports multiple assays and is adaptable for pathology, cytogenetics, and research applications. The Scan & Analysis platform automates slide scanning with a fully automated microscope and high-powered camera. The High Throughput Scanning platform facilitates automated slide analysis with minimal human intervention, while the Analysis & Review platform supports comprehensive case review and reporting.
This platform utilizes a dual-mode optical device for hyperspectral imaging and high-resolution CCD image capture, providing detailed spectral data for each pixel. It enhances Fourier Transform Infrared Spectroscopy (FTIR) by measuring multiple spectra simultaneously in the visual and low-near infrared range, supporting a spectral range of 400-1000 nm with high spectral resolution.
GenASIs SpectraView enhances sample analysis by imaging a spectral range twice as wide as the visual range, un-mixing multiple colors, and removing background signals. It allows differentiation of materials that appear identical under conventional imaging and supports the creation of color-coded maps of chemical similarities and differences, automatic detection and classification of objects, and quantitative analysis of spectral content.
The system covers a spectral range of 400-1000 nm, offers user-defined spectral resolution, supports both hyperspectral and monochromatic imaging, maintains light polarization, and has high transmission efficiency. It is compatible with various digital cameras and includes an advanced database for research and clinical applications.
GenASIs HyperSpectral is used in spectral karyotyping to identify chromosomes based on unique color combinations, aiding in cancer research and genetic analysis. In pathology, it performs spectral un-mixing to separate and analyze pure color images, enhancing the identification of dyes and removal of background signals.
The platform supports multiplexing colors for parallel analysis in cell biology, allowing detailed studies of intracellular processes and stem cell identification. It provides tools for analyzing complex biological samples.
- Fluorescent Dye and SNP Detection: Describes the use of fluorescent dyes and Single Nucleotide Polymorphisms (SNPs) attached to beads for genetic analysis, facilitated by a fluorescent reporter molecule and GenASIs SpectraView.
- Butterfly Wing Color Analysis: Discusses the nanometric structure of butterfly wings and its impact on color perception based on viewing angles.
- Bacterial Combinatorial Staining: Multi-color fluorescence staining is used to classify bacteria based on their DNA spectra, with GenASIs SpectraView aiding in spectral un-mixing and classification.
- GenASIs Case Data Manager (CDM): CDM serves as a central database for managing patient data across GenASIs applications, supporting paperless laboratories with advanced search, reporting, and data integrity features.
- Company Overview and Compliance: Highlights ASI's commitment to quality and regulatory compliance, including FDA clearance for various clinical applications and adherence to ISO standards.
- Regulatory Compliance: ASI's products are FDA cleared for specific clinical applications, ensuring adherence to international quality standards.
- Data Management: CDM offers robust data management, reporting, and security features, supporting multi-site laboratories and ensuring data integrity.
- Global Presence: ASI has a worldwide network of distributors and service partners, emphasizing its global reach and support capabilities.
The document underscores ASI's role as a leader in microscopy imaging solutions, providing advanced tools for genetic and pathological analysis with a strong focus on regulatory compliance and data management.
Catalog excerpts

GenASIs HyperSpectral HyperSpectral Imaging Solutions for Biomedical Applications
Open the catalog to page 1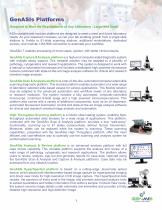
GenASIs Platforms Designed to Meet the Requirements of Any Laboratory - Large and Small ASI’s scalable and modular platforms are designed to meet current and future laboratory needs. As your caseload increases, so can your lab enabling growth from a single slide stations to 9-slide or 81-slide scanning stations, additional workstations, dedicated servers, and modular LIS/LIMS connection to automate your workflow. GenASIs 7 enables processing of more cases, quicker, with better clinical results. GenASIs Capture & Analysis platform is a high-end computer aided diagnostic system with multiple assay...
Open the catalog to page 3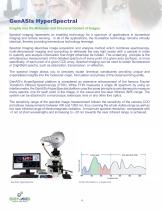
GenASIs HyperSpectral Insights Into the Molecular and Structural Content of Images Spectral imaging represents an enabling technology for a spectrum of applications in biomedical imaging and remote sensing. In all of the applications, the foundation technology remains virtually identical, thereby providing tremendous technology leverage. Spectral Imaging describes image acquisition and analysis method which combines spectroscopy, multi-dimensional imaging and computing to delineate the way light reacts with a sample in order to quantify and analyze information that might otherwise be hidden....
Open the catalog to page 4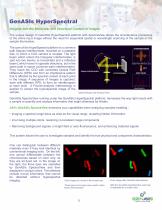
GenASIs HyperSpectral • Insights Into the Molecular and Structural Content of Images The unique design of GenASIs HyperSpectral platform with SpectraView allows the simultaneous processing of the entire input image without the need for sequential spatial or wavelength scanning of the sample or the sample illumination. The core of the HyperSpectral platform is a common path Sagnac interferometer, mounted on a rotatable disk, to which a CCD camera is coupled. The light beam which enters the triangular interferometer, is split into two beams (a transmitted and a reflected beam), which travel in...
Open the catalog to page 5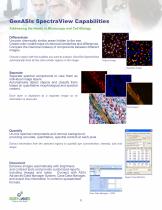
GenASIs SpectraView Capabilities Addressing the Needs in Microscopy and Cell Biology Differentiate Uncover chemically similar areas hidden to the eye. Create color-coded maps of chemical similarities and differences. Compare the chemical makeup of components between different images. Choose a region with the qualities you want to analyze, GenASIs SpectraView automatically finds all the other similar regions in the image Original Image Classified Image Separate Separate spectral components to view them as individual image layers. Automatically detect objects and classify them based on quantitative...
Open the catalog to page 6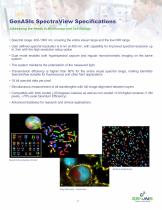
GenASIs SpectraView Specifications Addressing the Needs in Microscopy and Cell Biology • Spectral range: 400-1000 nm, covering the entire visual range and the low NIR range • User defined spectral resolution is 6 nm at 400 nm, with capability for improved spectral resolution up to 3nm with the high resolution setup option • Dual mode enables both hyperspectral capture and regular monochromatic imaging on the same system • The system maintains the polarization of the measured light • Transmission efficiency is higher than 80% for the entire visual spectral range, making GenASIs SpectraView suitable...
Open the catalog to page 7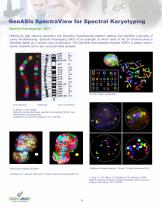
GenASIs SpectraView for Spectral Karyotyping Spectral Karyotyping - SKY Utilizing its high spectral resolution, the GenASIs HyperSpectral platform detects and identifies a plurality of colors simultaneously. Spectral Karyotyping (SKY) is an example, in which each of the 24 chromosomes is identified based on a unique color combination. The GenASIs HyperSpectral System HiSKY is widely used in cancer research and in pre- and post-natal analysis. Color Banding N. Kakazu, T.Abe (2006) Multicolor banding technique, spectral color banding (SCAN): new development and applications. Cytogenetic and Genome...
Open the catalog to page 8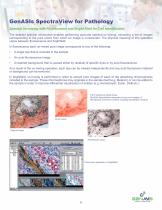
GenASIs SpectraView for Pathology Spectral Un-mixing with Fluorescence and Bright Field for Cell Identification The detailed spectral information enables performing accurate spectral un-mixing, extracting a set of images corresponding to the pure colors from which an image is constructed. The physical meaning of this operation varies between fluorescence and brightfield. In fluorescence each un-mixed pure image corresponds to any of the following: • A single dye that is included in the sample Unwanted background that is caused either by residual of specific dyes or by auto-fluorescence As a result...
Open the catalog to page 9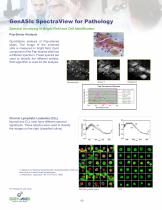
GenASIs SpectraView for Pathology Spectral Un-mixing in Bright Field and Cell Identification Pap-Smear Analysis Quantitative analysis of Pap-stained slides. The image of the smeared cells is measured in bright field. Each component of the Pap-stained slide has a different spectrum. These spectra are used to identify the different entities. SUN algorithm is used for the analysis. Chronic Lymphatic Leukemia (CLL) Normal and CLL cells have different spectral signatures. These spectra were used to classify the images on the right (classified colors) Z. Malik et al, Spectral morphometric characterization...
Open the catalog to page 10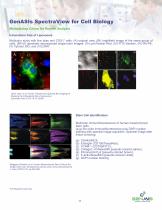
GenASIs SpectraView for Cell Biology Multiplexing Colors for Parallel Analysis Intracellular Fate of Liposomes Multicolor study with five dyes and COS-7 cells: (A) original view, (BI) brightfield image of the same group of cells, (BII-VI) spectrally decomposed single-color images: (II) LysoTracker Red, (III) FITC-dextran, (IV) Rh-PE, (V) Vybrant DiO, and (VI) DAPI. Ulrich Huth, et al. Fourier Transformed Spectral Bio-Imaging for Studying the Intracellular fate of Liposomes Cytometry Part A 57A:10-21 (2004) Stem Cell Identification Multicolor immunofluorescence of human mesenchymal stem cells....
Open the catalog to page 11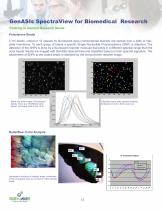
GenASIs SpectraView for Biomedical Research Catering to General Research Needs Polystyrene Beads 5 nm beads, coded to 10 classes by fluorescent dyes (combinatorial stained) are spread over a slide or titerplate membrane. To each group of beads a specific Single Nucleotide Polymorphisms (SNP) is attached. The detection of the SNPs is done by a fluorescent reporter molecule that emits in a different spectral range than the color beads. Beads are imaged with GenASIs SpectraView and classified based on their spectral signature. The attachment of SNPs to the coded beads is detected by the monochrome...
Open the catalog to page 12All Applied Spectral Imaging catalogs and technical brochures
 Karyotyping
2 Pages
 HiSKY
HiSKY2 Pages
 HIPath
2 Pages
 HER2/neu
2 Pages
 FISH Capture & Analysis
2 Pages
 CTC
CTC2 Pages
 CDM
CDM2 Pages
 ALK
ALK2 Pages
 Case Data Manager
2 Pages
 GenASIs Cytogenetics Suite
8 Pages
 GenASIs Pathology Suite
12 Pages
 GenASIs Platforms
2 Pages

- Cell imaging system
- Automatic cell imaging system
- Laboratory cell imaging system
- Fluorescence cell imaging system
- Research cell imaging system
- Diagnostic cell imaging system
- Confocal cell imaging system
- Molecular biology cell imaging system
- Tissue cell imaging system
- 3D cell imaging system
- Clinical cell imaging system
- Histopathology cell imaging system
- FISH cell imaging system