Simulator
1 /16Pages

Simulator
1 /16Pages
Catalog excerpts

BESA BESA Simulator Create your own evoked and induced data
Open the catalog to page 1
BESA Simulator can be used for simulating your own evoked and induced data! BESA Simulator runs on Windows, Mac OS, and Linux. Simply scan the above code
Open the catalog to page 3
Can YOU localize your simulated sources ?
Open the catalog to page 4
BESA Simulator is the perfect tool for simulating evoked and induced brain activity. Place your sources, assign them a time-course and save your data with an electrode layout of your choice. You can simulate average data or raw data choosing your own real dataset for overlaying the modeled activity. This allows simulating induced data, as well as evoked data. Use the simulated data to examine your source or coherence analysis techniques. Do you manage to localize the simulated sources? Use BESA Simulator to create your own theories about brain networks underlying your data and see if they hold...
Open the catalog to page 5
Create a Source Model Place sources, assign them a time-course, add noise
Open the catalog to page 6
Creating average data Start BESA Simulator. Place sources of your choice in the head schemes by double - clicking or pressing the button. You can move the sources my grabbing them using the left mouse - key. Change their orientation by grabbing the dipole tails. The mouse pointer will change from hand to a cross. The middle panel shows the default activity pattern of the sources along with a corresponding map. Note how the maps change when you change the orientation of the sources! The right panel shows the activity recorded by the EEG electrodes if the current sources were active. The electrode...
Open the catalog to page 7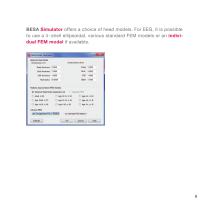
BESA Simulator offers a choice of head models. For EEG, it is possible to use a 4 - shell ellipsoidal, various standard FEM models or an individual FEM model if available.
Open the catalog to page 8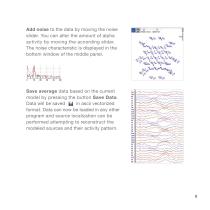
Add noise to the data by moving the noise slider. You can alter the amount of alpha activity by moving the according slider. The noise characteristic is displayed in the bottom window of the middle panel. Save average data based on the current model by pressing the button Save Data. Data will be saved U in ascii vectorized format. Data can now be loaded in any other program and source localization can be performed attempting to reconstruct the modeled sources and their activity pattern.
Open the catalog to page 9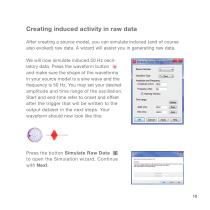
Creating induced activity in raw data After creating a source model, you can simulate induced (and of course also evoked) raw data. A wizard will assist you in generating raw data. We will now simulate induced 50 Hz oscillatory data. Press the waveform button and make sure the shape of the waveforms in your source model is a sine wave and the frequency is 50 Hz. You may set your desired amplitude and time range of the oscillation. Start and end-time refer to onset and offset after the trigger that will be written to the output dataset in the next steps. Your waveform should now look like this:...
Open the catalog to page 10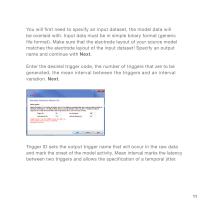
You will first need to specify an input dataset, the model data will be overlaid with. Input data must be in simple binary format (generic file format). Make sure that the electrode layout of your source model matches the electrode layout of the input dataset! Specify an output name and continue with Next. Enter the desired trigger code, the number of triggers that are to be generated, the mean interval between the triggers and an interval variation. Next. Trigger ID sets the output trigger name that will occur in the raw data and mark the onset of the model activity. Mean interval marks the...
Open the catalog to page 11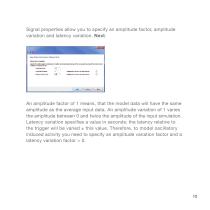
Signal properties allow you to specify an amplitude factor, amplitude variation and latency variation. Next. An amplitude factor of 1 means, that the model data will have the same amplitude as the average input data. An amplitude variation of 1 varies the amplitude between 0 and twice the amplitude of the input simulation. Latency variation specifies a value in seconds: the latency relative to the trigger will be varied ± this value. Therefore, to model oscillatory induced activity you need to specify an amplitude variation factor and a latency variation factor > 0.
Open the catalog to page 12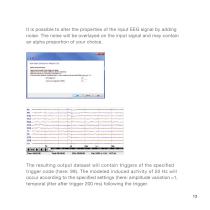
It is possible to alter the properties of the input EEG signal by adding noise. The noise will be overlayed on the input signal and may contain an alpha proportion of your choice. The resulting output dataset will contain triggers of the specified trigger code (here: 99). The modeled induced activity of 50 Hz will occur according to the specified settings (here: amplitude variation =1, temporal jitter after trigger 200 ms) following the trigger. 13
Open the catalog to page 13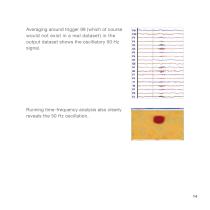
Averaging around trigger 99 (which of course would not exist in a real dataset) in the output dataset shows the oscillatory 50 Hz signal. Running time -frequency analysis also clearly reveals the 50 Hz oscillation.
Open the catalog to page 14
BESA GmbH Freihamer Str. 18 82166 Gräfelfing – Germany
Open the catalog to page 16All BESA GmbH catalogs and technical brochures
 Research 7.1
20 Pages
 Connectivity 1.0
20 Pages
 MRI 3.0
20 Pages
