- Catalogs
- Bruker Daltonics Inc.
- MALDI Imaging
MALDI Imaging

MALDI Imaging
- MALDI Imaging technology allows for the generation of molecular images without molecular probes, providing insights beyond histological phenotypes.
- Bruker Daltonics, in collaboration with academia, offers a comprehensive imaging solution in mass spectrometry.
- ImaBiotech utilizes Bruker instruments for high-performance MALDI Imaging, enhancing services in pharmaceutical and biomedical industries.
- MALDI-MS Imaging enables detailed examination of drug and metabolite distribution in tissues, aiding in understanding drug toxicity, pharmacology, pharmacokinetics, and drug transport.
- Dr. Axel Walch emphasizes the additional insights provided by molecular phenotypes.
- Dr. Pierre Chaurand highlights the role of Bruker Daltonics in advancing imaging mass spectrometry.
- Dr. Jonathan Stauber praises the integration of Bruker technology for superior research capabilities.
- Stephen Castellino notes the analytical advantages of MALDI-MS Imaging in preclinical settings.
Catalog excerpts

MALDI Imaging – Mass Spectrometric Imaging Direct Imaging of proteins, peptides, lipids, metabolites and drugs in tissues Innovation with Integrity Mass Spectrometry
Open the catalog to page 1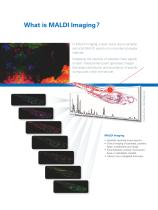
What is MALDI Imaging ? In MALDI Imaging, a laser scans tissue samples and a full MALDI spectrum is recorded at regular intervals. Example shown: Adult Medaka fish Displaying the intensity of selected mass signals at each measurement point generates images that depict distribution and abundance of specific compounds within the sample. MALDI Imaging: • • • • Spatially resolved mass spectra Direct imaging of peptides, proteins, lipids, metabolites and drugs No antibodies, probes, fluorescent dyes or radiolabels needed Allows true untargeted disc
Open the catalog to page 2
Cancer Research and Compound Distribution Studies By enabling histological correlation of molecular phenotypes and correlation of molecular signals to clinical endpoints, MALDI Imaging is a powerful tool in cancer research. MALDI Imaging is the only proteomic technology that enables detailed assignment of detected biomarkers to histological features. Colon cancer section: H&E stain (left) and MALDI image showing distribution of three proteins (right). MALDI Imaging is also used to study the distribution of lipids, proteins and secondary metabolites in plants. MALDI image showing distribution...
Open the catalog to page 3
A Clinical Discovery Workflow MALDI Imaging is perfectly suited to analyze biomarkers in tissue samples Patient Samples Group 1 MALDI Images Annotation Inflammation Tumor Connective Tissue Statistical Analysis Biomarker Bruker software supports the entire workflow, including statistical analysis
Open the catalog to page 4
Drug and Metabolite Localization MALDI Imaging is the only imaging technique that enables differentiation between pharmaceutical compounds and their metabolites. Whole body section of a rat dosed with a pharmaceutical compound. 1) Optical image. 2) Drug (green) localized mainly in the stomach and metabolite 1 (red) localized mainly in the Harderian gland. 3) Metabolite 2 (blue) and metabolite 3 (yellow) localized in the intestines. relative intensity relative intensity Mouse pancreas tumor tissue: A comparison of histology (left) and drug distribution (right) shows that a drug is contained in...
Open the catalog to page 5
Integrating Virtual Microscopy – Gaining Biological Insights While MALDI Imaging is usually not performed at cellular or sub-cellular resolution, the nature of the underlying tissue can only be determined by detailed microscopic analysis. For instance, the shape of cells and nuclei can be used to differentiate between cancerous and epithelial cells. Bruker has integrated the use of digital slides with flexImaging software, giving instant access to full microscopic resolution and allowing true untargeted molecular histology. Molecular histology with MALDI Imaging MALDI Imaging and histology are...
Open the catalog to page 6
flexlmaging - Leading Software for ■ Wizard driven user-friendly set up of ■ Explore datasets interactively by selecting masses in spectrum view ■ Direct access to single spectra ■ Superimpose digital slides and optical ■ Smart data compression for FTMS Advanced normalization options ■ Easy comparison of spectra in different ■ Comparison of different datasets ■ True 64-bit application supports large ■ Batch acquisition capabilities Explore datasets by integrated hierarchical clustering ■ Hierarchical clustering groups the mass spectra (molecular phenotypes) ■ Interactive dendrograms allow a simple...
Open the catalog to page 7
SCiLS Lab – Statistical Analysis Software SCiLS Lab is the advanced software for statistical analysis of MALDI imaging data. From analysis of large individual datasets to the comparative analysis of sample cohorts for biomarker discovery, SCiLS Lab turns data into knowledge. SCiLS Lab is the software of SCiLS, Bremen, and is a part of Bruker’s MALDI Molecular Imager solution. SCiLS Lab is exclusively available for Bruker data and seamlessly integrates with Bruker‘s flexImaging software. It reads annotated data from flexImaging and can export results back into flexImaging. SCiLS Lab implements...
Open the catalog to page 8
SCiLS Lab 3D – MALDI Imaging Goes 3D SCiLS Lab 3D is the dedicated software allowing for the reconstruction of spatial 3D models from serial MALDI Imaging datasets. Easy computer-assisted alignment of serial sections Rotate the dataset in all directions Low-intensity voxels can be made transparent to reveal a look inside 3D spatial distribution 3D spatial segmentation including search for co-localized mass signals All other beneficial features from SCiLS Lab 2D Spatial segmentation of a 3D mouse kidney dataset in SCiLS Lab 3D. The dataset consists of 122 serial sections measured at a spatial...
Open the catalog to page 9
Quantinetix – Dedicated Software for Drug Quantification Quantinetix™ is a Quantitative Imaging Mass Spectrometry Software that provides quantitation of target compounds (taking into account the ion suppression effect) following Mass spectrometry imaging experiments. Quantinetix is developed by ImaBiotech, a leading service provider for MALDI Imaging. Quantinetix™ supports Bruker MALDITOF and FTMS data. It normalizes and quantifies molecules in several ways: On-tissue dilution (Nilsson et al., PLoS One, 2010) Isotopic labeling compound (Stoeckli et al., Int. J Mass Spectrom, 2007) Ion suppression...
Open the catalog to page 10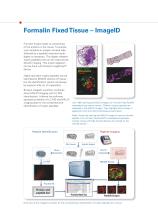
Formalin Fixed Tissue – ImageID Formalin fixation leads to crosslinking of the proteins in the tissue. To analyze such samples an antigen retrieval step followed by a spatially resolved tryptic digest is necessary. This digest releases tryptic peptides that can be measured by MALDI Imaging. This tryptic digestion can be done with Brukers ImagePrep™ device. Highly abundant tryptic peptides can be identified by MS/MS directly off tissue, but the identification results will always be superior after an LC-separation. Brukers imageID workflow combines direct MALDI Imaging with LC-MS identification....
Open the catalog to page 11
Sample Preparation High-quality sample preparation is key to successful MALDI Imaging The Bruker ImagePrep provides automatic and reproducible sample preparation in an automated push-button An intuitive user interface allows conveni- ent adjustment of key parameters: matrix thickness, incubation time and wetness. The matrix aerosol is generated by vibrational vaporization. Soft gravitatio- nal deposition of microdroplets delivers maximum spatial resolution. ImagePrep can also be used to perform spatially resolved tryptic digests of tissue sections, which facilitates the study and identification...
Open the catalog to page 12All Bruker Daltonics Inc. catalogs and technical brochures
 Life Science Mass Spectrometry
20 Pages
 MASS SPECTROMETRY
20 Pages
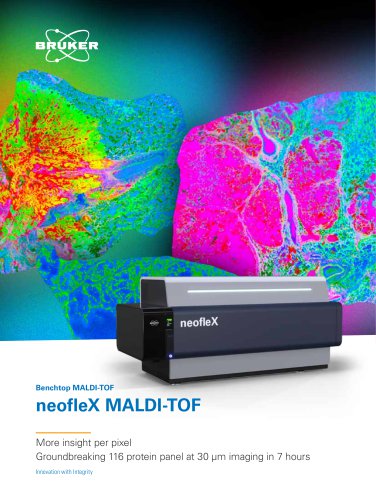 neofleX™
12 Pages
 timsOmniTM
20 Pages
Archived catalogs
 micrOTOF-Q III
6 Pages
 Toxtyper
6 Pages
 Radiation Backpack Sentry
4 Pages
 impact HD
12 Pages
 Product Overview
20 Pages
 The new autoflex speed
10 Pages
 solarix XR
12 Pages
 SIGIS II
2 Pages
 VeroTect
4 Pages
 µRAID
µRAID4 Pages
 SVG 2 and Probes
6 Pages
 MM2
MM26 Pages
 RAID M100
6 Pages
 RAID S2
6 Pages
 RAID XP
4 Pages
 RAID AFM
4 Pages
 pTD
pTD2 Pages
 DE-tector
6 Pages
 ImagePrep
4 Pages
 micrOTOF II
8 Pages
 impact II
12 Pages
 EVOQ
EVOQ6 Pages
 maxis II
12 Pages
 ProteinScape
8 Pages
 Bruker ToxScreener
6 Pages
 MALDI Biotyper CA System
12 Pages
 MALDI Biotyper Clinical IVD
6 Pages
 MBT Mycobacteria Library
4 Pages
 PesticideScreener 2.0
8 Pages
 rapifleX™ MALDI Tissuetyper™
8 Pages
 MBT Pharma
8 Pages
 MBT Disposable Targets US
2 Pages
 MBT BTS US
2 Pages
 MBT Sepsityper
6 Pages
 MBT Consumables RUO
4 Pages
 MBT SMART IVD
4 Pages
 MBT Pilot RUO
4 Pages
 MBT Galaxy RUO
4 Pages
 Quant Proteomics
8 Pages
 timsTOF Pro
6 Pages
 TargetScreener
6 Pages
 timsTOF™
8 Pages
 TASQ Software
4 Pages
 BioPharma Compass® 2.0
8 Pages
 Metabolomics
8 Pages
 spotOn™
4 Pages
 Product Overview
16 Pages
 Toxtyper
8 Pages
 CMC-assist
2 Pages
 IntelliSlidesTM
2 Pages
 MALDI Biotyper® CA System
12 Pages
 Label-Free Molecular Imaging
12 Pages
 EVOQ - 2014
6 Pages


- Visualization software
- Control software
- Reporting software
- BRUKER laboratory software
- BRUKER spectrometer
- Monitoring software
- Acquisition software
- BRUKER benchtop spectrometer
- Simulation software
- Chromatography system
- Import software
- Test software
- Server software
- Data analysis software
- Real-time software
- Research software
- Compact spectrometer
- Interpretation software
- BRUKER mass spectrometer