Group: Axion BioSystems

Catalog excerpts

Organoid Counting Corning Cell Counter Appnote Corning Cell Counter - Displays the new application that automatically detects organoids using bright-field image analysis. Together with Corning®, CytoSMART already introduced an automated cell counter for counting of mammalian cells called the Corning® Cell Counter. A new, powerful and simple software application has been developed that enables organoid counting with the Corning® Cell Counter (fig 1). Manually counting organoids is a routine part of laboratory operations, but is time consuming and user dependent. To overcome these issues CytoSMART has introduced an organoid counting application that is: Fast & Accurate - thanks to its cloud-based image analysis algorithm Low-cost - works with common reusable glass hemocytometer. No consumables required Figure 1: Detecting Organoids using the CytoSMART Organoid Counting Software. Brightfield images of organoids are analyzed by the image analysis algorithm and allows for organoid detection over a wide range of sizes. allows for optimal accuracy in data acquisition. Users obtain information on the quantity and size of the organoids in their sample. This data is displayed in separate interfaces that provide a clear overview of the characteristics of the organoid population: Precise - software allows for data gating and image selection for statistical analysis The Organoid Counting software can analyze a single image in less than three seconds* utilizing the CytoSMART™ Cloud. This cloud computing ability enables the rapid images analysis (fig 1,2). High Accuracy The software contains an image analysis algorithm that optimized for organoid detection. This state-of-the-art analysis tool * Measured using a 73 Mbps download speed and a 20 Mbps upload speed. Figure 2: Software interface. The output of the analysis provides the user with organoid size and count. The results are updated in real time based on user defined size gatin
Open the catalog to page 1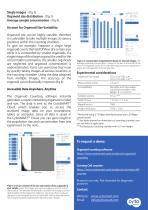
Single images - (fig 2) Organoid size distribution - (fig 3) Average sample concentration - (fig 4). Account for Organoid Size Variability Organoid size can be highly variable, therefore it is advisable to take multiple images at various positions within the counting chamber. To give an example: Suppose a single large organoid covers the Field Of View of a certain area while it is surrounded by smaller organoids. If a single image of that large organoid is used for the concentration estimation, the smaller organoids are neglected and organoid concentration is underestimated. Users can...
Open the catalog to page 2All Axion BioSystems catalogs and technical brochures
-
 Maestro TrayZ Brochure
6 Pages
-
 Maestro Pro Brochure
8 Pages
-
 CytoSMART Omni
11 Pages


