


EMG Signal Analysis

EMG Signal Analysis
This technical note discusses the main classes of Electromyography (EMG) analysis, assuming quality EMG data has been acquired. It references previous notes on EMG sensor placement and signal quality.
- EMG Amplitude and Muscle Force
- Activation Intervals
- Fatigue
- Root Mean-Square (RMS)
- Threshold
- Power Spectral Density (PSD)
- Mean and Median Frequency
- Amplitude Analysis
- Timing Analysis
- Spectral Analysis
The document introduces three main classes of EMG signal analysis: amplitude, timing, and spectral analysis, providing insights into EMG signals and their applications.
The amplitude of the EMG signal is stochastic but generally proportional to muscle force. RMS is a key calculation for understanding signal power. Despite complex factors affecting direct correlation, the qualitative relationship is useful in biofeedback, ergonomic assessments, and biomechanics.
Correlating EMG amplitude with muscle force helps determine muscle activity. Timing analysis is crucial for understanding muscle recruitment and control during movements, such as gait analysis. Activation intervals provide insights into muscle contraction patterns.
This analysis uses the frequency domain, employing Fourier Transform to evaluate frequency contributions. It requires stationary data, often achieved through constant-force, isometric contractions. PSD provides power distribution across frequencies, aiding in fatigue studies by observing mean and median frequency changes over time.
Timing and spectral analyses are valuable in biomechanics, sports science, and physical therapy, offering insights into muscle coordination, rehabilitation, and fatigue.
Catalog excerpts

Technical Note 103: EMG Signal Analysis Purpose This technical note addresses the main classes of EMG analysis. It assumes that quality EMG data has already been acquired. Please see Technical Note 101: EMG Sensor Placement and Technical Note 102: EMG Signal Quality for more details. • Amplitude Analysis • Timing Analysis • Spectral Analysis Surface EMG Concepts • EMG Amplitude and Muscle Force • Activation Intervals • Fatigue Software Concepts • • • • www.delsys.com Root Mean-Square Threshold Power Spectral Density Mean and Median Frequency 617 236 0599 (Tel)
Open the catalog to page 1
Introduction This document is one of a series of technical notes designed to address important concepts dealing with Delsys® hardware and software. The goal of this technical note is to introduce the three main classes of EMG signal analysis. These fundamental techniques have classically yielded the most insight into the EMG signal. Some example applications for each type of analysis will also be discussed. Amplitude Analysis The amplitude of the EMG signal at any instant in time is stochastic or random. In most circumstances, however, visual inspection of the gross EMG signal reveals that its...
Open the catalog to page 2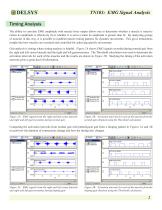
Timing Analysis The ability to correlate EMG amplitude with muscle force output allows one to determine whether a muscle is inactive (when its amplitude is effectively 0) or whether it is active (when its amplitude is greater than 0). By analyzing groups of muscles in this way, it is possible to establish muscle timing patterns for dynamic movements. This gives tremendous insight into how muscles are recruited and controlled for achieving specific movements. Gait analysis is setting where timing analysis is helpful. Figure 2A shows EMG signals recorded during normal gait from the right and left...
Open the catalog to page 3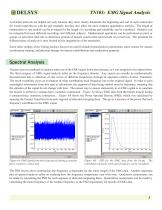
Activation intervals are helpful not only because they more clearly demarcate the beginning and end of each contraction for visual inspection as with the gait example, but they also allow for more complex quantitative analysis. The length of contractions or rest periods can be averaged for the length of a recording and variability can be examined. Statistics can be compared between different recordings and different subjects. Mathematical operations can be performed on pairs or groups of activation intervals to determine periods of muscle coactivation and periods of overall rest. The potential...
Open the catalog to page 4
The most important application of spectral analysis is the study of muscle fatigue. It has been shown that the mean and median frequencies of the EMG signal decrease with time during a task that induces fatigue. Figure 5A shows the median frequency calculated as a function of time for the data from the biceps. Figure 5B shows a curve fit to this data to quantify the decrease in median frequency with time. Figure 5A: Median frequency of the biceps EMG data as a function of time. Figure 5B: Median frequency of the biceps EMG data as a function of time along with a curvefit to quantify the decrease...
Open the catalog to page 5All Delsys catalogs and technical brochures
 EMG Signal Quality
6 Pages
 EMG Sensor Placement
10 Pages
 Delsys Product Catalog (2021)
19 Pages

- Analysis software
- Tablet computer software
- Tablet PC software
- Control software
- Windows software
- Monitoring software
- Acquisition software
- Design software
- Software module
- Data management software
- Recording software
- Server-based software
- Data analysis software
- EMG system
- Module
- Analysis software module
- Medical software module
- Portable EMG
- Electrocardiography software
- Modeling software