- Catalogs
- Hamamatsu Photonics France
- Mini-spectrometer
Mini-spectrometer
1 /7Pages
Mini-spectrometer
1 /7Pages
Catalog excerpts

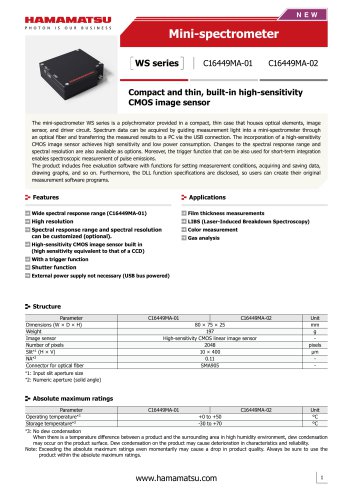
WS seriesCompact and thin, built-in high-sensitivity CMOS image sensor The mini-spectrometer WS series is a polychromator provided in a compact, thin case that houses optical elements, image sensor, and driver circuit. Spectrum data can be acquired by guiding measurement light into a mini-spectrometer through an optical fiber and transferring the measured results to a PC via the USB connection. The incorporation of a high-sensitivity CMOS image sensor achieves high sensitivity and low power consumption. Changes to the spectral response range and spectral resolution are also available as options. Moreover, the trigger function that can be also used for short-term integration enables spectroscopic measurement of pulse emissions. The product includes free evaluation software with functions for setting measurement conditions, acquiring and saving data, drawing graphs, and so on. Furthermore, the DLL function specifications are disclosed, so users can create their original measurement software programs. 3 Wide spectral response range (C16449MA-01) 3 High resolution 3 Spectral response range and spectral resolution can be customized (optional). 3 High-sensitivity CMOS image sensor built in (high sensitivity equivalent to that of a CCD) 3 With a trigger function 3 Shutter function 3 External power supply not necessary (USB bus powered) S- Applications 3 Film thickness measurements 3 LIBS (Laser-Induced Breakdown Spectroscopy) 3 Color measurement 3 Gas analysis When there is a temperature difference between a product and the surrounding area in high humidity environment, dew condensation may occur on the product surface. Dew condensation on the product may cause deterioration in characteristics and reliability. Note: Exceeding the absolute maximum ratings even momentarily may cause a drop in product quality. Always be sure to use the product within the absolute maximum ratings.
Open the catalog to page 1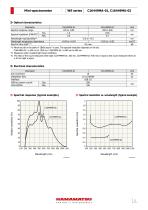
Optical characteristics Parameter Spectral response range Spectral resolution (FWHM)*2 Wavelength reproducibility* Wavelength temperature dependence Spectral stray light*2 *4 3 *4: When the slit in the table in “ Structure” is used. The spectral resolution depends on the slit. C16449MA-01: λ=190 nm to 1100 nm, C16449MA-02: λ=200 nm to 600 nm *5: Measured under constant light input conditions *6: The ratio of the count measured when light (C16449MA-01: 650 nm, C16449MA-02: 400 nm) is input to the count measured when an ± 40 nm light is input. Electrical characteristics Parameter A/D conversion...
Open the catalog to page 2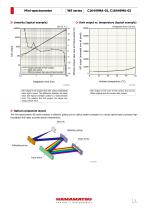
Dark output vs. temperature (typical example) 20 15 Typical example of A/D output Ideal A/D output Difference between ideal value and typical example 1 A/D output (averaged over all pixels) Difference between ideal value and typical example (%) Linearity (typical example) A/D output is the output with dark output subtracted when light is input. The difference between the ideal value and typical example contains a measurement error. The smaller the A/D output, the larger the measurement error. A/D output is the sum of the sensor and circuit offset outputs and the sensor dark output. Optical component...
Open the catalog to page 3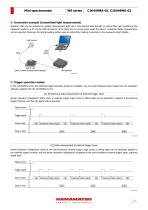
Spectrum data can be acquired by guiding measurement light into a mini-spectrometer through an optical fiber and transferring the measured results to a PC via the USB connection. Since there are no moving parts inside the device, constantly stable measurements can be expected. Moreover, the optical guiding section uses an optical fiber making connection to the measured object flexible. In the C16449MA-01/-02, the following trigger operation modes are available. You can switch between these modes from the evaluation software supplied with the C16449MA-01/-02. Sensor operation (integration) starts...
Open the catalog to page 4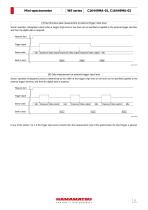
Sensor operation (integration) starts when a trigger (high level or low level can be specified) is applied to the external trigger terminal, and then the digital data is acquired. Measure start Trigger signal Sensor state Idle Exposure | Data output Exposure | Data output Exposure | Data output | Idle Sensor operation (integration) period is determined by the width of the trigger (high level or low level can be specified) applied to the external trigger terminal, and then the digital data is acquired. Measure start In any of the modes 1 to 4, if the trigger input cycle is shorter than the measurement...
Open the catalog to page 5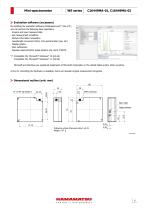
Evaluation software (accessory) By installing the evaluation software (DataViewer.exe)*7 into a PC, you can perform the following basic operations. · Acquire and save measured data · Set measurement conditions odule information acquisition ·M (wavelength conversion factor, mini-spectrometer type, etc.) · Display graphs · Dark subtraction · Gaussian approximation (peak position and count, FWHM) *7: C ompatible OS: Microsoft® Windows® 10 (64-bit) Compatible OS: Microsoft® Windows® 11 (64-bit) Microsoft and Windows are registered trademarks of Microsoft Corporation in the United States and/or other...
Open the catalog to page 6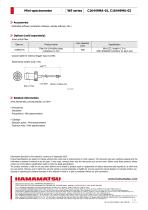
■ Dedicated software (evaluation software, sample software, DLL) ■ Input optical fiber ■ Coaxial cable for external trigger input A12763 Dimensional outline (unit: mm) ■ Selection guide / Mini-spectrometers ■ Technical note / Mini-spectrometers Information described in this material is current as of September 2025. Product specifications are subject to change without prior notice due to improvements or other reasons. This document has been carefully prepared and the information contained is believed to be accurate. In rare cases, however, there may be inaccuracies such as text errors. Before...
Open the catalog to page 7All Hamamatsu Photonics France catalogs and technical brochures
 NZConnectMD Scan
3 Pages
 ORCA-HALO
3 Pages
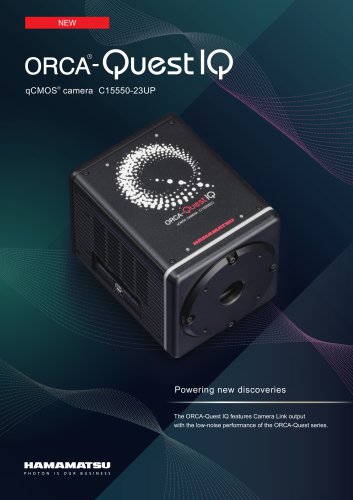 ORCA-QuestlQ
4 Pages
 TDI camera C10000-801
2 Pages
Archived catalogs
 X-ray TDI camera C12300-321
4 Pages
 ORCA-spark
2 Pages
 BT-CCD camera C8000-30
2 Pages
 ORCA Lightning
8 Pages
 digital CMOS camera C14130-20P
12 Pages
 ORCA-Fusion
28 Pages

- Analysis software
- Visualization software
- Radiology software
- Control software
- Laboratory software
- Windows software
- CMOS camera
- Camera with USB port
- Diagnostic software
- Cloud-based software
- Design software
- Acquisition software
- Capture software
- Traceability software
- Medical camera
- Microscope camera
- Web-based software
- Sharing software
- Server software