Enterprise Dose Dashboard
1 /2Pages

Enterprise Dose Dashboard
1 /2Pages
Catalog excerpts

Enterprise Dose Dashboard Available via myLDR.com Gain access to enterprise-wide dose dashboards to compare multiple facilities across an entire organization Enterprise Dose Dashboards enable you to more effectively track dose levels across an enterprise. At the same time, you can more easily track improvements as a result of conducting training, investing in shielding, or buying other protective equipment. The dashboards provide data to help drive change and improve radiation safety across the enterprise. Also, see how your facilities stack up against each other and the LANDAUER ALARA Index*. Dashboards are provided for ALARA Account Comparison, ALARA Subaccount Comparison and Pregnant Participants Review (Cumulative and Monthly). All dashboards are also accompanied by data in a sortable table format. ALARA Account Comparison - Across the enterprise by Account Select a quarter to compare Accounts ACTIVE PARTICIPANTS PARTICIPANTS OVER ALARA 1 PARTICIPANTS OVER ALARA 2 NEARSHORE HEALTHCARE Enterprise ALARA 1 Index Enterprise ALARA 2 Index Landauer ALARA 1 Index Landauer ALARA 2 Index All Saints Participants over ALARA 1: 34 (18%) Utilize the dashboard to see how Accounts compare to the ALARA 1 and 2 enterprise average and Landauer ALARA Index*. *LANDAUER ALARA Index represents all clients’ participants who have exceeded the levels. Calculation is based upon the previous three calendar years of data. Track and identify ALARA 1 and 2 performance and compare it across Accounts. Use filters to select from the last eight quarters of data. % Of Participants over ALARA Limits ALARA Subaccount Comparison - Across the enterprise by Subaccount ACTIVE PARTICIPANTS With a more targeted view, easily identify and compare selected Subaccountsacross the enterprise with ALARA 1 and 2 exceeders. This is especially helpful for comparing similar Subaccounts at different Accounts where you know or suspect the dose is typically higher. For example, filter for all Cath Labs across the enterprise to see where there are opportunities for training or improvement at the Subaccount level. PARTICIPANTS OVER ALARA 1 PARTICIPANTS OVER ALARA 2 ACCOUNTS WITH SELECTED SUBACCOUNTS % IN ACCOUNTS WITH SELECTED SUBACCOUNTS NEARSHORE HEALTHCARE Participants over ALARA 1 & 2 - Subaccount Comparison Enterprise ALARA 1 Index Enterprise ALARA 2 Index Landauer ALARA 1 Index Landauer ALARA 2 Index Cath Lab-(n:66)* ALL SAINTS - FLUOROSCOPY Active Participants over ALARA 2: 6 (18%) Chelsea General Chelsea General Holby City Holby City Sacred Heart Sacred Heart James Rivers James Rivers Country General Country General % Of Participants over ALARA Limits Drill down into more specifics with RadFacts™ Dashboards, also available through myLDR.com Enterprise Dose Dashboards is compatible with Firefox and Internet Explorer 8 and above
Open the catalog to page 1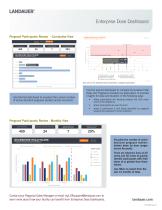
Enterprise Dose Dashboard Pregnant Participants Review - Cumulative View CUMULATIVE 2013 JULY Select aMONTHLY to compare Accounts quarter ACTIVE PARTICIPANTS DECLARED PREGNANT PARTICIPANTS PARTICIPANTS OVER CUMULATIVE PREGNANCY DOSE LIMIT % DECLARED PARTICIPANTS OVER CUMULATIVE PREGNANCY LIMIT NEARSHORE HEALTHCARE Declared Pregnant Participants By Account Under the fetal limit (<=9 months) Number of Delcared Pregnant Participants Select Items to View More Info Chelsea General Holby City Sacred Heart St. Hugh’s James Rivers County General Each dot on the dashboard above represents a pregnant participant....
Open the catalog to page 2All LANDAUER catalogs and technical brochures
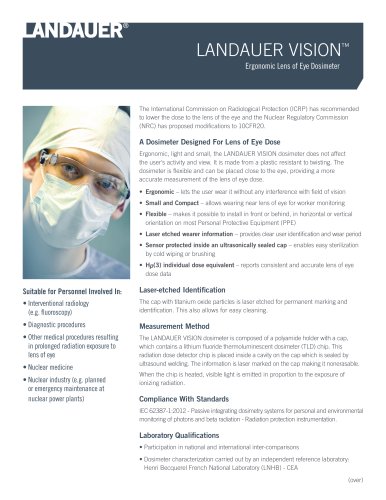 LANDAUER VISION™
2 Pages
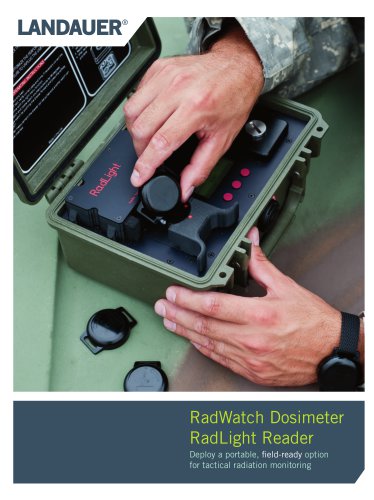 RadWatch Dosimeter
6 Pages
 Saturn® TLD Ring
2 Pages
 Trusted Dosimetry Systems
4 Pages
 nanoDot™ Dosimeter
2 Pages
Archived catalogs
 microSTAR® ii and nanoDots™
4 Pages
 Dosimetry Analytical Readers
2 Pages

- Analysis software
- Visualization software
- Radiology software
- Control software
- Reporting software
- Monitoring software
- Diagnostic software
- Hospital software
- Dental software
- CT software
- X-ray radiation monitoring
- Veterinary software
- Validation software
- Gamma ray radiation monitoring
- Centralized software
- Beta ray radiation monitoring
- Personal dosimeter
- X-ray personal dosimeter
- Alpha ray radiation monitoring
- Gamma ray personal dosimeter