- Catalogs
- Liberty Sport
- Sports Eye Injury Statistics
Sports Eye Injury Statistics
1 /1Page
Sports Eye Injury Statistics
1 /1Page
Catalog excerpts

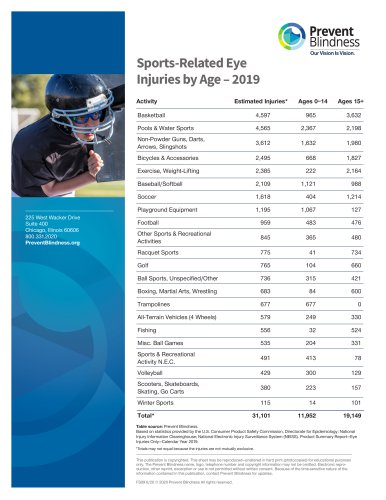
Estimated Injuries* Ages 0-14 Ages 15+ Basketball Pools & Water Sports Non-Powder Guns, Darts, Arrows, Slingshots Bicycles & Accessories Exercise, Weight-Lifting Baseball/Softball Soccer Playground Equipment Football Other Sports & Recreational Activities Racquet Sports Golf Ball Sports, Unspecified/Other Boxing, Martial Arts, Wrestling Trampolines All-Terrain Vehicles (4 Wheels) Fishing Misc. Ball Games Sports & Recreational Activity N.E.C. Scooters, Skateboards, Skating, Go Carts Winter Sports Table source: Prevent Blindness. Based on statistics provided by the U.S. Consumer Product Safety Commission, Directorate for Epidemiology; National Injury Information Clearinghouse; National Electronic Injury Surveillance System (NEISS). Product Summary Report-Eye Injuries Only-Calendar Year 2019. *Totals may not equal because the injuries are not mutually exclusive. This publication is copyrighted. This sheet may be reproduced-unaltered in hard print (photocopied) for educational purposes only. The Prevent Blindness name, logo, telephone number and copyright information may not be omitted. Electronic reproduction, other reprint, excerption or use is not permitted without written consent. Because of the time-sensitive nature of the information contained in this publication, contact Prevent Blindness for updates. FS09 6/20 © 2020 Prevent Blindness All rights reserved.
Open the catalog to page 1