
- Catalogs
- Ocean Insight
- OceanView Installation and Operation Manual

OceanView Installation and Operation Manual

OceanView Installation and Operation Manual
This manual provides guidance for users of OceanView products, focusing on installation and operational procedures. It includes updates and references to related documentation.
This section offers an overview of the OceanView product, highlighting its USB spectrometer and device control capabilities, key features, and spectroscopic functions. Instructions for obtaining updates are also included.
The installation chapter details the minimum system requirements and provides step-by-step instructions for installing OceanView on Windows, Macintosh, and Linux platforms. It also covers product activation and licensing, including starting a free trial and activating the software with a product key.
This chapter explains how to launch OceanView and navigate its user interface, including the welcome screen, quick view, spectroscopy application wizards, and various views such as graph and schematic views. Instructions for using the device manager and controlling acquisitions are also provided.
This section describes the use of various wizards within OceanView, such as the Select Data Source Wizard and Set Acquisition Parameters Wizard, as well as the Peak Metrics Wizard and Strip Chart Wizard.
This section provides an overview of the schematic view, including how to use, display, and size it. It explains the icons used in the schematic view and the order of operations for creating a schematic view.
- USB Spectrometer and Device Control
- Spectroscopic Functions
- Installation on Multiple Platforms
- Product Activation and Licensing
- User Interface Navigation
- Use of Wizards for Data Management
- Schematic View for Device Management
Contact details for sales, orders, and technical support are provided for various regions including the Americas, Europe, Middle East, Africa, and Asia.
This manual provides installation and configuration instructions for the OceanView Spectrometer Operating Software, aimed at users needing to set up and operate the system.
The document updates the Open Project procedure for Version 1.5.2 of the software.
- Chapter 1: Introduction - Overview of OceanView software, highlighting its stability, user settings persistence, and device features.
- Chapter 2: Installation - Instructions for installing and configuring the software.
- Chapter 3: User Interface - Describes the operation of OceanView through its user interface, including views, controls, and menus.
- Chapter 4: Wizards - Procedures for using wizards to capture measurement data.
- Chapter 5: Schematic View - Instructions for using the schematic view, with descriptions of each icon.
Links to additional documentation for various Ocean Optics products are provided, accessible via the Ocean Optics website.
OceanView is a Java-based spectroscopy software compatible with Windows, Macintosh, and Linux. It supports multiple USB spectrometers and provides graphical and numeric data representation. The software is designed for applications like upwelling/downwelling measurements and process monitoring.
OceanView supports a wide range of Ocean Optics spectrometers and USB devices, including Apex, Flame, HR2000, HR4000, Jaz, Maya, NIR, QE, STS, Torus, USB, and Ventana series.
The software offers a customizable user interface, persistence of user settings, manual saving and reloading of project settings, and specialized calculations on spectral data. It supports various experiments and processing modes such as absorbance, reflection, fluorescence, transmission, Raman, and more.
OceanView allows for absorbance, reflectance, emission, absolute irradiance, and Raman experiments. It includes signal-processing functions like dark-signal correction, pixel smoothing, and signal averaging. The software supports time-acquisition experiments and provides control over data acquisition and graph display.
OceanView offers data-collection options, including storing and retrieving spectra, saving data as ASCII files, and printing or copying spectral data to other software. It also provides software-controlled triggering options for external events.
The software includes one year of free web-based updates, with alerts for new updates.
The document provides detailed instructions for installing OceanView software on Windows, Macintosh, and Linux operating systems. It emphasizes not connecting the spectrometer to the computer until the software is installed.
Minimum system requirements include a monitor resolution of 1024x768, 1.5 GB RAM, and specific processor types such as Intel Core II Duo or AMD Athlon. The software requires 300 MB of free hard drive space.
- Windows: Close all applications, download the software, and follow the installer wizard. Manual driver installation may be necessary if the spectrometer is not recognized.
- Macintosh: Requires administrative access and possibly a manual Java installation. The software is installed by dragging the application icon to the Applications folder.
- Linux: Involves using terminal commands and may require additional libraries. SELinux settings might need modification for the software to run.
OceanView can be activated online using a product key. An offline registration option is available if there is no internet connection. The software also offers a 10-day free trial.
After installation, OceanView can be launched from the Start menu on Windows or the Applications folder on Mac. The Welcome Screen offers options like Quick View, loading saved projects, and using Spectroscopy Application Wizards.
This mode displays raw, unprocessed data from the spectrometer, useful for setting acquisition parameters and troubleshooting.
These wizards guide users through setting up measurements and optimizing acquisition settings.
Projects can be saved and reloaded, allowing users to quickly enter processed modes. The same spectrometers used to create a project must be connected to reload it.
To restore a previous session in OceanView, the same spectrometer(s) must be connected as when the session was last closed. Without these, the session cannot be reloaded.
OceanView provides two main views: Graph View and Schematic View. Graph View displays spectrum graphs and offers options like Graph Layer Options, Strip Charts, Spectral Splicing, and Peak finding. Schematic View presents data in a diagram format, allowing for advanced functionalities such as algorithm nodes for mathematical operations, setting subranges, interpolating spectral data, retrieving device properties, and previewing spectra.
OceanView includes context-sensitive help accessible via the Help button in dialog boxes, tooltips, and the Help menu.
These controls allow users to create, open, save, and remove projects, and manage devices. Different acquisition types are available depending on the device, including Spectrometer, I²C, SPI, and others.
Users can build applications for various spectroscopy types such as Absorbance, Raman, Relative Irradiance, Transmission, Fluorescence, and more.
This tool allows users to connect/disconnect devices, add new devices, rescan for devices, simulate devices, and set automatic connections.
These controls allow users to set signal-conditioning settings, adjust integration time, scans to average, boxcar width, and more. The controls vary based on the spectrometer type.
Users can control data acquisition, set integration time, enable electric dark correction, and adjust other parameters like trigger mode and x-axis units.
Specific controls for IDRaman products include continuous acquisition, integration time settings, laser power adjustments, and sample matching with libraries.
These include snap-on cuvette holders with light sources for various measurements. Users can adjust LED voltages and lock settings.
This tab allows users to customize the Main Controls tab by adding or removing controls, ensuring settings are applied consistently across acquisitions.
Users can configure GPIO pins as inputs or outputs for controlling external devices or reading voltages.
1. Input Mode: If using an external voltage source or monitoring an external device, set the pin to input mode by unchecking the 'Out?' box.
2. Output Mode: Determine if the pin will use its alternative function to monitor internal device characteristics. For example, on a USB2000+ spectrometer, enabling the alt function on GPIO-1 outputs a 48 MHz signal.
3. Alt Function: Check the 'Alt?' box to monitor internal characteristics. If unchecked, manually toggle the output state using the 'Value' control.
4. Value Box: Acts as an indicator in input mode, showing a check mark if voltage is above the threshold.
- Consists of three rows for each GPIO pin: output value, output enable, and alt function.
- Control check boxes manually or via a scalar node. Positive scalar values enable, negative disable.
- Offers various controls such as zooming, panning, and overlaying spectra.
- Allows saving and exporting data in different formats and configurations.
- Customize graph appearance, annotations, and visible spectrum overlays.
- Includes options for chart area, axes, and trend line selection.
- Configure file format, directory, and naming conventions for saved data.
- Set save intervals and conditions for automatic data saving.
Allows customization of spectral trend lines and overlays. Users can change colors, reset to default, select line width, and determine the number of trendline trails.
Enables specification of precision for wavelength and intensity, setting axis ranges, and selecting units. Changes affect data display and are visible when data is saved or copied.
Allows customization of font size, style, and color for Scalar View windows.
- File Menu: Options include creating new applications, opening/saving projects, and accessing tools like Combine Calibration.
- Window Menu: Provides access to Acquisition Group, Schematic, Library, and more for customizing the display.
- Help Menu: Offers access to welcome screen, licensing, help contents, updates, and software specifications.
OceanView offers wizards for data capture, storage, and processing. Key wizards include:
- Select Data Source Wizard: Chooses the spectrometer for use.
- Set Acquisition Parameters Wizard: Sets measurement parameters and controls.
- Select Spectroscopy Wizard: Offers various spectroscopy processes like Absorbance, Concentration, and more.
Measures light absorption by a sample, using Beer’s Law to relate absorbance to concentration.
Determines substance concentration in a solution using Beer-Lambert Law or calibration from known solutions.
This document provides detailed instructions for using various spectroscopy wizards in the OceanView software. It covers procedures for setting up experiments, capturing data, and analyzing results across different spectroscopy modes.
- Load a .con file to populate fields or manually enter compound name and concentration units.
- Build a table of known concentration and absorbance values by entering data and using the 'Get Absorbance' function.
- Use regression options to analyze data trends.
- Save data in a .con file for future use.
- Transmission measures energy passing through a sample; reflectance measures energy returned by a surface.
- Both require storing reference and background spectra before accessing their respective modes.
- Configure Raman settings by storing a background spectrum and setting the laser wavelength.
- Measures energy emitted by materials excited by light at shorter wavelengths.
- Requires storing a background spectrum.
- Absolute irradiance measures true light intensity without needing a reference spectrum.
- Relative irradiance compares light intensity to a reference emission source.
- Photometry measures luminous flux, illuminance, and luminous intensity.
- Color measurements include CRI and CCT, requiring specific calibration and reference spectra.
- Allows for the isolation and analysis of spectral peaks using threshold and baseline adjustments.
The document provides comprehensive guidance on using OceanView wizards for various spectroscopy applications, emphasizing the importance of proper setup and calibration for accurate data analysis.
Two methods are available for peak finding: Local Maxima and Derivative. Local Maxima searches for all local maxima within user-defined parameters. The Derivative method requires selecting a derivative order number, with the first derivative locating stationary points and the second derivative locating inflection points. A minimum peak width must be chosen to exclude narrow peaks, useful for eliminating noise-induced fluctuations.
Spatial filtering options include Boxcar, Savitzky-Golay, or None. Boxcar is a simple case of Savitzky-Golay filtering with a polynomial order of 0. For Savitzky-Golay, the polynomial order must be less than the total number of pixels used in the filter. The Filter Span is calculated as 2n+1 pixels.
The Strip Chart Wizard in OceanView allows tracking of processes and spectral events over time. Users can select data from a single wavelength, a ratio of two wavelengths, or an average/integral over a range. Data can be updated after every scan or every nth scan, with options to stop after a set number of scans, a specific time, or never.
OceanView allows splicing of spectral data from multiple spectrometers into a single spectrum, applicable only to processed spectra like Absorbance or Transmission. Users can adjust spectral ranges and apply them to create a unified spectrum.
The Schematic View displays data in a diagram format, allowing manipulation of data flow from spectrometers through processing steps. It includes features like algorithm nodes for math functions, setting subranges, interpolating data, and retrieving device properties. Users can add new devices, nodes, and views, and connect them using drag-and-drop methods.
Nodes represent data capture points and are categorized by function. Users can create nodes by right-clicking on the schematic and selecting from a list. Nodes can be connected, viewed, or deleted as needed. The Acquire node is essential for data acquisition from devices.
Devices are automatically detected and placed on the schematic. Users can add new devices via the Device Manager, rescan for devices, and connect specific devices. Ethernet-connected devices can be added by entering their IP address.
This document provides detailed instructions on using OceanView software for spectrometer data acquisition and processing. It outlines the steps to configure devices, manage data nodes, and visualize results.
Users can select acquisition nodes based on the device type. The Spectrometer node is automatically connected and cannot be transferred. Device features can be accessed and modified through the Acquisition Parameter Controls menu, where parameters like Integration Time and Signal Averaging can be adjusted.
Data can be static or dynamic, and classified as scalar or array. Nodes are connected based on compatible input/output data types. Users can add nodes by right-clicking on the schematic diagram and selecting from a categorized list.
Nodes can be renamed, duplicated, or deleted. Acquire nodes allow snapshots of spectral data, which are stored in Data Source nodes. Output Control nodes enable parameter adjustments using schematic data.
Arrows indicate data flow direction. Connections are made by matching output and input data types. Incompatible connections are not allowed. Solid lines represent periodically updated data, while dashed lines indicate one-time data transmission.
Nodes can be moved without affecting data flow. The schematic window can be expanded, and grid dots help organize the layout. Users can zoom in/out and clear nodes to start fresh.
Acquired data can be displayed in Graph View using View nodes. Multiple spectra can be shown in one Graph or Table View node. Scalar and Color View nodes display specific data types.
A step-by-step procedure is provided for connecting nodes, including setting up GPIO options and connecting various nodes like subrange and constant nodes.
The document includes a comprehensive list of schematic view icons, detailing their functions, input/output types, and user controls. Examples include Absolute Value, Acquisition, Add Color View, and more.
1. DataProp Node:
- Outputs scalar data.
- User selects data property by clicking on the appropriate row.
- Connects to an Acquire node to select the desired property for output.
2. Data Source Nodes:
- Outdated Data Source: Captured data needs refreshing; outputs static arrays or scalars.
- DataSource Node: Captures and exports data from various input nodes; outputs static arrays or scalars.
- Procedure: Select a data source, choose the appropriate source, and confirm.
3. Advanced Math Functions:
- Delta x: Outputs wavelength distribution function; input is an array.
- Derivative: Calculates spatially based derivative; input is an array.
- Energy, Power, Photons (EPP): Calculates radiometric quantities; requires Absolute Irradiance and Integration Time.
- Evaluate Function (FnEval): Outputs y value of a polynomial function; requires regression node and scalar input.
4. Basic Math Functions:
- Divide: Outputs quotient of inputs; requires two inputs.
- Exponential: Outputs e raised to the power of input.
- Logarithm (Log10): Outputs base 10 logarithm.
- Multiply: Outputs product of inputs.
- Negate: Changes sign of input data.
5. Color Math Functions:
- Dominant Wavelength & Purity: Outputs dominant wavelength and excitation purity.
- Emissive Color: Applies parameters to input data from an Irradiance Unit Labels node.
- Reflective Color: Applies parameters to input data from a Reflection Unit Labels node.
6. Calculus Functions:
- Integral: Outputs integral of input data array; user selects integration method.
7. Array Math Functions:
- Interpolation: Outputs data array with specified x-axis intervals and range.
- Linear Regression: Outputs scalar coefficients for regression; user selects polynomial order.
8. Bounds Functions:
- Maximum/Minimum Value: Outputs larger/smaller of two input values.
- Peaks: Calculates and outputs peak locations; user defines peak finding method and parameters.
9. Photometry:
- Calculates photometric quantities for an absolute irradiance-calibrated spectrometer.
10. File Operations:
- File: Outputs data from a saved file; only opens tab-delimited format.
- File Writer: Saves and exports processed data to an ASCII file.
11. Output Control:
- Adjusts spectrometer settings using output from other nodes; user selects input source and control type.
12. Miscellaneous Functions:
- Floor: Rounds input data down to the previous integer.
- Power: Outputs input data raised to a specified power.
This document provides technical specifications and procedures for various data processing nodes used in spectrometry and mathematical operations. It includes details on input/output types, user controls, and procedural steps for each node.
- Round Node: Rounds input data to the nearest integer. Accepts array or scalar inputs and outputs.
- Running Average Node: Calculates a weighted running average of dynamic scalar inputs. The weight factor influences data stability and responsiveness to recent changes.
- Savitzky-Golay Filter: Smooths input data using a polynomial filter. User controls include point filter span and polynomial order, with specific guidelines for setting these parameters.
- Selector Node: Extracts a single dimension from a multidimensional array. User selects output parameters via a drop-down menu.
- Simulated Spectrometer: Allows spectrometer simulation without a physical device. Offers various controls like light source type and acquisition delay.
- Sine Node: Computes the sine of input data in radians, supporting both scalar and array formats.
- Splice Node: Combines multiple arrays into a single array, with user controls for wavelength range settings.
- Square Root Node: Outputs the square root of scalar or array inputs.
- Standard Deviation Node: Calculates the standard deviation of an array, outputting a scalar value.
- SubRange Node: Limits the x-axis bounds of an array, outputting a truncated array.
- Subtract Node: Outputs the difference between two inputs, which can be scalar or array.
- Tangent Node: Computes the tangent of input data in radians.
- Time Derivative Node: Outputs a time-based derivative of dynamic scalar inputs.
- Time Trend Node: Manages memory buffer for data acquisition, with controls for buffer size and mode.
- Unit Labels Node: Alters graph view labels and units, applicable to both scalar and array outputs.
- Update Rate Node: Adjusts scanning parameters for data update frequency.
- Whiteness Node: Outputs CIE Whiteness and Tint values from input data.
- Detailed steps are provided for configuring nodes like the Selector, Simulated Spectrometer, and Splice, including user interactions and expected outcomes.
- Each node description includes user controls, such as weight factors, polynomial orders, and buffer settings, with recommendations for optimal use.
- Some nodes have specific requirements, such as input data format (e.g., radians for trigonometric functions) and compatibility with other nodes.
Catalog excerpts
OceanView Installation and Operation Manual For Products: OceanView Document: 000-20000-310-02-201602c
Open the catalog to page 1
AMERICAS & WORLD HEADQUARTERS Phone: +1 727-733-2447 Fax: +1 727-733-3962 Sales: Orders: Support: [email protected] [email protected] [email protected] Ocean Optics, Inc. 830 Douglas Ave. Dunedin, FL 34698 USA Manufacturing & Logistics 4301 Metric Dr. Winter Park, FL 32792 USA EUROPE, MIDDLE EAST & AFRICA Sales & Support Geograaf 24 6921 EW Duiven The Netherlands Manufacturing & Logistics Maybachstrasse 11 73760 Ostfildern Germany ASIA Phone: +86 21-6295-6600 Fax: +86 21-6295-6708 Email: [email protected] Japan & Korea: +82 10-8514-3797 Ocean Optics Asia 666 Gubei Road...
Open the catalog to page 2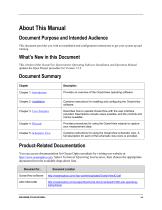
About This Manual Document Purpose and Intended Audience This document provides you with an installation and configuration instructions to get your system up and running. What’s New in this Document This version of the OceanView Spectrometer Operating Software Installation and Operation Manual updates the Open Project procedure for Version 1.5.2. Document Summary Chapter Provides an overview of the OceanView operating software. Contains instructions for installing and configuring the OceanView software. Chapter 3: User Interface Describes how to operate OceanView with the user interface provided....
Open the catalog to page 9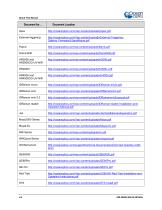
About This Manual Document Location External triggering IDRaman micro IDRaman mini IDRaman reader NIRQuest Series
Open the catalog to page 10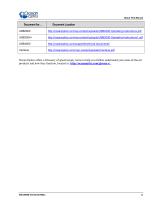
About This Manual Document Location Ocean Optics offers a Glossary of spectroscopy terms to help you further understand your state-of-the-art products and how they function, located at: http://oceanoptics.com/glossary/.
Open the catalog to page 11
About This Manual
Open the catalog to page 12
Introduction Product Overview Ocean Optics has taken Java-based spectroscopy software to the next level with OceanView. This next logical step in the evolution of spectrometer software provides good stability, persistence of user settings, a broad scope of device features, and consistent file saving and loading procedures. OceanView operates on 32- and 64-bit Windows, Macintosh and Linux operating systems. The software can control any Ocean Optics USB spectrometer. For the latest release notes, see OceanView on our Software Downloads page. USB Spectrometer and Device Control OceanView easily...
Open the catalog to page 13
QE65000 Scientific-grade Spectrometer QE65 Pro Scientific-grade Spectrometer QE Pro Spectrometer STS Micro Spectrometers Torus Spectrometer USB650 Spectrometer USB2000 Spectrometer USB2000+ Spectrometer USB2000-FLG Spectrometer USB4000 Spectrometer Ventana High Sensitivity Spectrometers OceanView also supports the following USB devices: ADC1000-USB A/D Converter Flame Direct Attach UV-VIS Integrated Sampling System Flame Direct Attach VIS-NIR Integrated Sampling System IDRaman micro IDRaman mini IDRaman mini 2.0 IDRaman reader ISS-UV-VIS USB-AOUT Analog...
Open the catalog to page 14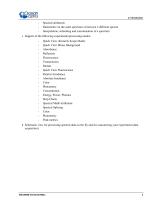
Spectral arithmetic Ratiometric on the same spectrum or between 2 different spectra Interpolation, subsetting and concatenation of a spectrum Support of the following experiments/processing modes: Quick View (formerly Scope Mode) Quick View Minus Background Absorbance Reflection Fluorescence Transmission Raman Quick View Fluorescence Relative Irradiance Absolute Irradiance Color Photometry Concentration Energy, Power, Photons Strip Charts Spectral Math/Arithmetic Spectral Splicing Color Photometry Peak metrics Schematic view for processing spectral data on the fly and for customizing your...
Open the catalog to page 15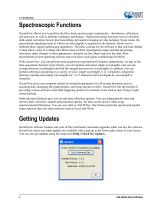
Spectroscopic Functions OceanView allows you to perform the three basic spectroscopic experiments – absorbance, reflectance and emission, as well as absolute irradiance and Raman. Signal-processing functions such as electrical dark-signal correction, boxcar pixel smoothing and signal averaging are also included. Scope mode, the spectrometer operating mode in which raw data (signal) is acquired by the detector, allows you to establish these signal-conditioning parameters. The basic concept for the software is that real-time display of data allows users to evaluate the effectiveness of their experimental...
Open the catalog to page 16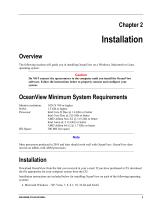
Installation Overview The following sections will guide you in installing OceanView on a Windows, Macintosh or Linux operating system. Caution Do NOT connect the spectrometer to the computer until you install the OceanView software. Follow the instructions below to properly connect and configure your system. OceanView Minimum System Requirements Monitor resolution: RAM: Processor: 1024 X 768 or higher 1.5 GB or higher Intel Core II Duo @ 1.4 GHz or better Intel Core Duo @ 2.0 GHz or better AMD Athlon Neo X2 @ 1.6 GHz or better Intel Atom @ 2.13 GHz or better AMD Athlon 64 x2 @ 1.7 GHz or better...
Open the catalog to page 17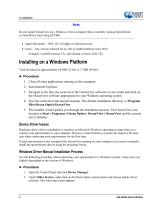
Note Do not install OceanView on a Windows 32-bit computer that is currently running SpectraSuite or OmniDriver (and using EZUSB). Apple Macintosh – OSX 10.5 or higher on Intel processor Linux – Any version released for an x86 or amd64 platform since 2010 Example: CentOS(Version 5.5), and Ubuntu (version 10.4LTS) Installing on a Windows Platform Total download is approximately 64 MB (32-bit) or 71 MB (64-bit). ► Procedure 1. Close all other applications running on the computer. 2. Start Internet Explorer. 3. Navigate to the link you received to the OceanView software in your email and click...
Open the catalog to page 18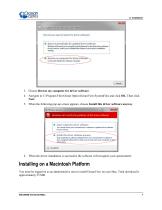
3. Choose Browse my computer for driver software. 4. Navigate to C:\Program Files\Ocean Optics\OceanView\SystemFiles and click OK. Then click Next. 5. When the following pop-up screen appears, choose Install this driver software anyway. 6. When the driver installation is successful, the software will recognize your spectrometer. Installing on a Macintosh Platform You must be logged on as an administrative user to install OceanView on your Mac. Total download is approximately 35 MB.
Open the catalog to page 19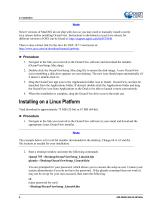
Note Newer versions of MacOSX do not ship with Java so you may need to manually install a recent Java release before installing OceanView. Instructions to download a recent Java release for different versions of OSX can be found at: http://support.apple.com/kb/HT5648 There is also a direct link for the Java for OSX 10.7.3 and newer at: http://www.java.com/en/download/manual.jsp#mac ► Procedure 1. Navigate to the link you received to the OceanView software and download the installer (OceanViewSetup_Mac.dmg). 2. Double-click the OceanViewSetup_Mac.dmg file to mount the disk image. A new OceanView...
Open the catalog to page 20All Ocean Insight catalogs and technical brochures
 NIRQuest+ NIR Spectrometers
2 Pages
 OCEAN SR SERIES
37 Pages
 Ocean ST Microspectrometer
2 Pages

Archived catalogs
 Flame Spectrometer
2 Pages
 USB2000+
2 Pages
 USB4000
2 Pages
 HR4000
2 Pages
 HR2000+
43 Pages
 Light Sources
20 Pages
 Sampling Accessories
26 Pages
 Spectrometers
58 Pages
 Jaz Modular Spectroscopy
18 Pages
 Fibers and Probes
22 Pages
- Windows software
- Protective glasses
- Laboratory rack
- LED light source
- Acquisition software
- Design software
- Treatment software
- Measurement software
- Benchtop spectrometer
- Safety glasses
- Compact light source
- Digital controller
- Microscope light source
- Compact spectrometer
- Research spectrometer
- Spectrometer for the pharmaceutical industry
- Optical spectrometer
- Optical fiber
- NIR spectroscope