- Catalogs
- Randox Laboratories
- Basic QC Stastics
- Products
- Catalogs
- News & Trends
- Exhibitions
Basic QC Stastics

Basic QC Stastics
Quality Control (QC) in laboratories is crucial for ensuring accurate patient diagnoses and treatments, as 60-70% of medical decisions are based on lab results. QC processes monitor and evaluate laboratory procedures to detect and correct deficiencies before patient results are released.
Types of Quality Control
External Quality Assessment (EQA): EQA compares a laboratory's performance with others using the same methods through blind sampling, providing an accuracy benchmark.
Internal Quality Control (IQC): IQC involves daily QC operations within the lab, comparing results to predetermined target values to ensure accuracy before releasing patient results.
Importance of Running QC
Failure to run adequate QC can lead to patient misdiagnosis, treatment delays, inappropriate treatments, and increased costs due to retests. In the US, avoidable retests cost $200 million annually.
Frequency of QC
The frequency of QC depends on factors like test volume, risk level, staff competency, and method stability. ISO 15189 recommends QC frequency based on procedure stability and patient risk.
Basic QC Statistics
Mean ( ): Used to identify the 'true value' of data points. A minimum of 20 data points is recommended for establishing the mean.
Standard Deviation (SD): Measures data dispersion around the mean, indicating precision. A 2SD range is commonly used for result acceptability.
Coefficient of Variation (CV): Expresses SD as a percentage of the mean, allowing precision comparison across different concentrations.
Levey-Jennings Charts
These charts use the mean and ±3SD range to identify trends, biases, and precision issues in QC data, helping laboratories troubleshoot problematic tests.
Complete QC Process
1. Establish mean and performance limits.
2. Run daily QC material.
3. Create a Levey-Jennings Chart.
4. Evaluate QC data before releasing patient results.
Randox Laboratories
Randox provides multi-analyte third-party controls, reducing costs and storage needs while ensuring unbiased performance assessment. Their Acusera range meets ISO 15189:2012 requirements and offers flexibility for various laboratory sizes and budgets.
Software Features
Acusera 24•7 software aids in QC data monitoring and interpretation, offering features like interactive charts, automatic calculation of performance metrics, and real-time peer group statistics.
Catalog excerpts

EDUCATIONAL GUIDE Basic QC Statistics QUALITY CONTROL
Open the catalog to page 1
Basic QC Statistics qual-ity con-trol - noun A system of maintaining standards in manufactured products by testing a sample of the output against the specification. (Oxford Dictionary; Oxford Universities Press 2013) When testing patient samples the outcome of the result will often be used to diagnose the patient, with an estimated 60 to 70% of all decisions regarding a patient’s diagnosis and treatment based on laboratory test results. As a consequence, the quality of laboratory work is of the utmost importance in ensuring patients are correctly diagnosed and administered the appropriate treatment....
Open the catalog to page 2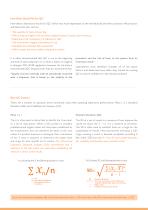
How Often Should We Run QC? How often a laboratory should run QC will be very much dependant on the individual lab and their processes. Many factors will determine this, such as: • The quantity of tests run per day • Which tests are higher risk and have a higher impact if results are erroneous • Experience and competency of laboratory staff • The instrument, reagent and method in use • Available time between QC evaluations • Which assays are more stable compared to others It is often recommended that QC is run at the beginning and end of each analytical run or when a batch of reagents is changed....
Open the catalog to page 3
Working Examples of Standard Deviation The individual results in example A and example B are significantly different and yet they have the same . SD can be used to distinguish between the sets of data by assessing the variability of the values around the . The SD for example B is much larger than that for example A as the values are more spread out about the . Example A illustrates a set of data with a close distribution around the representing better precision or result reproducibility producing a lower standard deviation. Ranges & Limits Limits for data acceptability are defined using the and...
Open the catalog to page 4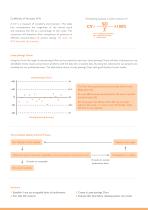
The following equation is used to measure CV: A CV is a measure of variability and precision. This takes into consideration the magnitude of the overall result and expresses the SD as a percentage of the mean. This calculation will therefore allow comparison of precision at different concentrations of patient testing. The lower the %CV the better the precision. CV = Coefficient of Variation SD = Standard Deviation = Mean result Levey-Jennings Charts Using the and ±3s range a Levey-Jennings Chart can be created for each test. Levey-Jennings Charts will alert a laboratory to any identifiable trends,...
Open the catalog to page 5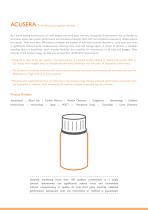
ACUSERA True third party quality controls As a world leading manufacturer of multi-analyte true third party controls, thousands of laboratories rely on Randox to accurately assess test system performance and ultimately empower them with the confidence required to release patient test results. With more than 390 analytes available, the number of individual controls required to cover your test menu is significantly reduced while simultaneously reducing costs, time and storage space. A choice of formats is available, including liquid or lyophilised, which ensures flexibility and suitability for...
Open the catalog to page 6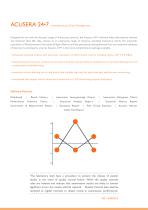
ACUSERA 24•7 Interlaboratory Data Management Designed for use with the Acusera range of third party controls, the Acusera 24•7 software helps laboratories monitor and interpret their QC data. Access to an impressive range of features, including interactive charts, the automatic calculation of Measurement Uncertainty & Sigma Metrics and live peer group data generated from our extensive database of laboratory participants, ensures Acusera 24•7 is the most comprehensive package available. • Advanced statistical analysis with automatic calculation of performance metrics including; Sigma, UM, TE &...
Open the catalog to page 7
Copyright © 2019 Randox Laboratories Ltd. All rights Reserved. VAT number: GB 151682708. Product availability may vary from country to country. Some products may be for Research Use Only. For more information on product application and availability, please contact your local Randox Representative.
Open the catalog to page 8All Randox Laboratories catalogs and technical brochures
 LT735 Vivalytic Overview
32 Pages
 Acusera New Controls
8 Pages
 Acusera 24.7
24 Pages
 Acusera Third Party Controls
108 Pages
 Acusera SMART Controls
12 Pages
 Company Overview
40 Pages
 Reagents Brochure
64 Pages
 sdLDL-C
8 Pages
 RX SERIES ANALYSER OVERVIEW
24 Pages
 RX modena
20 Pages
 RX misano
20 Pages
 RX Daytona Plus
20 Pages
 Rx Imola
20 Pages
 RX Monaco
20 Pages
 2024 Product List
64 Pages
 LT107 Evidence Investigator
32 Pages
 VeraSTAT-V
16 Pages
 LT033 RIQAS Explained
64 Pages
 VERASTAT
16 Pages
 Endocrine Array
4 Pages
 Cerebral Arrays
4 Pages
 Thyroid Arrays
4 Pages
 Respiratory Multiplex Array
8 Pages
 LT253 Molecular Diagnostics
20 Pages
 LT367 FH Array Brochure
4 Pages
 The role of EQA in QC
8 Pages
 Commutability Guide
4 Pages
 How to measure uncertainty
8 Pages
 ISO 15189 Educational Guide
8 Pages
 Troubleshooting QC Errors
8 Pages
 Qnostics
52 Pages
 Adiponectin LT519
28 Pages
 Specific Proteins
40 Pages
 Linearity sets
12 Pages
 Antioxidants
16 Pages
 Cardiology & Lipid Testing
28 Pages
 Diabetes Portfolio
28 Pages
 Total Bile Acids
4 Pages
 VIVALYTIC
30 Pages
 RANDOX DISCOVERY
36 Pages
 HbA1c
HbA1c2 Pages
 Preparing QC
1 Page
 Point of Care Testing
12 Pages
 Guide to running QC
1 Page
 Tumour Marker Arrays
4 Pages
 Which QC is the Right QC
8 Pages
 How often is right for QC
6 Pages
 Cardiac Risk Multiplex Array
4 Pages
 LT241 Metabolic Array MAY15
8 Pages
 KRAS / BRAF / PIK3CA Array*
4 Pages
 Custom Arrays for Biochip
12 Pages
 LT169 Cardiac Array
4 Pages


Archived catalogs
 ACUSERA
108 Pages
 Rx Daytona
16 Pages
 Evidence Evolution
28 Pages
 Evidence
16 Pages
 Evidence Investigator
20 Pages
 Molecular Testing
16 Pages
 STI Multiplex Array
8 Pages
 Metabolic Syndrome Arrays
8 Pages
 Fertility Array
4 Pages
 Evidence Investigator
16 Pages
 Evidence
16 Pages

- RANDOX test kit
- RANDOX solution reagent
- RANDOX molecular biology reagent
- RANDOX research reagent
- RANDOX laboratory reagent
- RANDOX diagnostic reagent
- Cassette rapid test
- RANDOX protein reagent
- RANDOX rapid virus test
- RANDOX molecular biology test kit
- RANDOX enzyme reagent
- Histology reagent
- Respiratory disease assay kit
- RANDOX rapid infectious disease test
- Cytology reagent
- Cassette detection kit
- RANDOX biochemistry reagent
- Clinical chemistry analyzer
- Real-time PCR assay kit
- RANDOX quality control reagent