 Website:
Randox Laboratories
Group: Randox
Catalog excerpts

RANDOX INTERNATIONAL QUALITY ASSESSMENT SCHEME
Open the catalog to page 1
RIQAS THE LARGEST INTERNATIONAL EQA SCHEME WITH OVER 55,000 LAB PARTICIPANTS
Open the catalog to page 2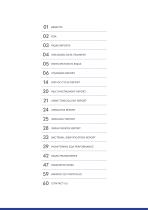
RIQAS REPORTS WEB-BASED DATA TRANSFER STANDARD REPORT END-OF-CYCLE REPORT MULTI-INSTRUMENT REPORT URINE TOXICOLOGY REPORT URINALYSIS REPORT SEROLOGY REPORT SERUM INDICES REPORT BACTERIAL IDENTIFICATION REPORT RIQAS PROGRAMMES PARAMETER INDEX
Open the catalog to page 3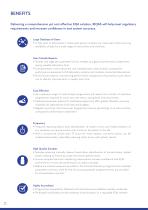
BENEFITS Delivering a comprehensive yet cost effective EQA solution, RIQAS will help meet regulatory requirements and increase confidence in test system accuracy. Large Database of Users • A high level of participation means peer group numbers are maximised whilst ensuring availability of data for a wide range of instruments and methods. User-friendly Reports • Simple, one page per parameter format, enables at-a-glance performance assessment, saving valuable laboratory time. • Complimentary multi-instrument and interlaboratory reports allow comparative performance assessment of all...
Open the catalog to page 4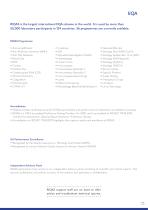
RIQAS Programmes • Ammonia/Ethanol • Anti-Mullerian Hormone (AMH) • Anti-TSH Receptor • Blood Gas • BNP • Cardiac • Cardiac Plus • Cerebrospinal Fluid (CSF) • Clinical Chemistry • Coagulation • CO-Oximetry • CYFRA 21-1 • Cytokines ESR Glycated Haemoglobin (HbA1c) • Haematology • Human Urine • Immunoassay • Immunoassay Speciality 1 • Immunoassay Speciality 2 • Immunosuppressant Drugs • Lipids • Maternal Screening Microbiology (Bacterial Identification) • Neonatal Bilirubin • Serology (Anti-SARS-CoV-2) • Serology Epstein Barr Virus (EBV) • Serology (HIV/Hepatitis) • Serology (Syphilis) •...
Open the catalog to page 5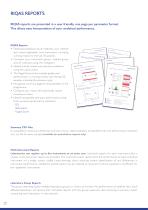
RIQAS REPORTS RIQAS reports are presented in a user-friendly, one page per parameter format. This allows easy interpretation of your analytical performance. RIQAS Reports • tatistical breakdown by all methods, your method S and, where applicable, your instrument, including running means for the last 10 samples. • ompare your instrument group, method group C and all methods using the histogram. • Identify trends, biases and precision problems using the visual charts. • The Target Score chart uniquely grades your performance in a moving window over the last 20 samples, including the previous...
Open the catalog to page 6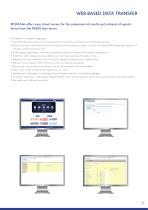
WEB-BASED DATA TRANSFER RIQAS.Net offers easy, direct access for the submission of results and retrieval of reports direct from the RIQAS host server. • Available in multiple languages. • Confidentiality and security is maintained through the use of password protected access. • Submit current, corrected and future results (normal policies apply), directly into the RIQAS database. Receipt of results is confirmed by e-mail. •Multi-lingual registration identifier provides simple identification of multiple registrations. • Additions and changes to assay details can be made quickly and easily...
Open the catalog to page 7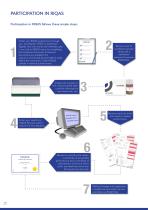
PARTICIPATION IN RIQAS Participation in RIQAS follows these simple steps: Order your RIQAS programmes through your local Randox Office or Distributor. Register the instruments and methods used in your lab on RIQAS.net or by completing the enrolment document. Enrolment documents are available from riqas.com and should be submitted 3 weeks before the cycle starts. Check RIQAS policies in method questionnaire. Analyse the sample on the recommended date, carefully following the instructions for use. Enter your results via RIQAS.Net and submit before the final deadline. Receive a set of numbered...
Open the catalog to page 8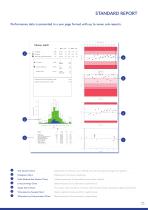
STANDARD REPORT Performance data is presented in a one page format with up to seven sub-reports. )NWEQUG OIFN #EEGRVCDNG NKOKVU FGTKXGF HTQO $KQNQIKECN 8CTKCVKQP #EEGRVCDNG NKOKVU QH RGTHQTOCPEG HQT 4+3#5 *GZQMKPCUG )NWEQUG QZKFCUG 1TVJQ 8KVTQU /KETQ5NKFG 5[UVGOU )NWEQUG FGJ[FTQIGPCUG )1&$GEMOCP OGVJQF 1VJGT &T[ %JGOKUVT[ #ICRRG )1&2#2 1Z[IGP GNGEVTQFG 8KVTQU &6&6 ++ Text Section Chart: Statistics for all methods, your method and instrument group (programme specific). Histogram Chart: Method and instrument comparison. Multi-Method Stat Section Chart: Enables assessment of the performance of...
Open the catalog to page 9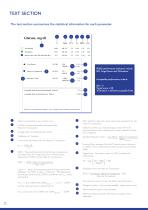
TEXT SECTION The text section summarises the statistical information for each parameter. /106*.; %.+0+%#. %*'/+564; )NWEQUG OIFN RIQAS performance indicators include SDI, Target Score and %Deviation. Acceptable performance criteria: 6&2# SDI < 2 Target score 50 %Deviation ≤ defined acceptable limits #EEGRVCDNG NKOKVU QH RGTHQTOCPEG HQT 4+3#5 #EEGRVCDNG NKOKVU FGTKXGF HTQO $KQNQIKECN 8CTKCVKQP Performance statement appears here if performance indicators exceed limits Number of returned results used to generate Mean for Comparison. After statistical reduction, some results are excluded from...
Open the catalog to page 10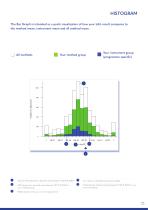
/GCP/GCP HQT %QORCTKUQP HQT %QORCTKUQP The Bar Graph is intended as a quick visualisation of how your lab’s result compares to the method mean, instrument mean and all method mean. Your instrument group (programme specific) Your method group #EEGRVCDNG NKOKVU NKOKVU QH RGTHQTOCPEG4+3#5 #EEGRVCDNG QH RGTHQTOCPEG HQT HQT 4+3#5 #EEGRVCDNG NKOKVU NKOKVU FGTKXGF $KQNQIKECN 8CTKCVKQP #EEGRVCDNG FGTKXGF HTQO HTQO $KQNQIKECN 8CTKCVKQP *GZQMKPCUG *GZQMKPCUG )NWEQUG QZKFCUG )NWEQUG QZKFCUG 1TVJQ 1TVJQ 8KVTQU /KETQ5NKFG 5[UVGOU 8KVTQU /KETQ5NKFG 5[UVGOU )NWEQUG FGJ[FTQIGPCUG )NWEQUG FGJ[FTQIGPCUG...
Open the catalog to page 11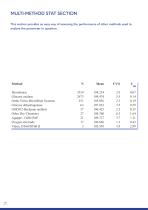
This section provides an easy way of assessing the performance of other methods used to analyse the parameter in question. Hexokinase Glucose oxidase Ortho Vitros MicroSlide Systems Glucose dehydrogenase GOD/02-Beckman method Other Dry Chemistry Agappe - GOD-PAP Oxygen electrode Vitros, DT60/DT60 II
Open the catalog to page 12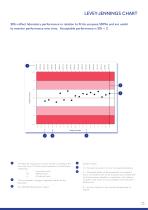
LEVEY-JENNINGS CHART SDIs reflect laboratory performance in relation to fit-for-purpose SDPAs and are useful to monitor performance over time. Acceptable performance is SDI < 2. N = No result returned in time for this registration\sample. C = Corrected results will be accepted for non-analytical errors. Corrected results will be accepted up to 4 weeks after the final submission deadline, on application, with evidence of analysis. Late results are only accepted if there has been a Randox error. This line indicates change in registration details for this a parameter. Sample number. The Mean...
Open the catalog to page 13All Randox Laboratories catalogs and technical brochures
-
LT735 Vivalytic Overview
32 Pages
-
Acusera New Controls
8 Pages
-
Acusera 24.7
24 Pages
-
Acusera Third Party Controls
108 Pages
-
Acusera SMART Controls
12 Pages
-
Company Overview
40 Pages
-
Reagents Brochure
64 Pages
-
sdLDL-C
8 Pages
-
RX SERIES ANALYSER OVERVIEW
24 Pages
-
RX modena
20 Pages
-
RX misano
20 Pages
-
RX Daytona Plus
20 Pages
-
Rx Imola
20 Pages
-
RX Monaco
20 Pages
-
2024 Product List
64 Pages
-
LT107 Evidence Investigator
32 Pages
-
VeraSTAT-V
16 Pages
-
VERASTAT
16 Pages
-
Endocrine Array
4 Pages
-
Cerebral Arrays
4 Pages
-
Thyroid Arrays
4 Pages
-
Respiratory Multiplex Array
8 Pages
-
LT253 Molecular Diagnostics
20 Pages
-
LT367 FH Array Brochure
4 Pages
-
The role of EQA in QC
8 Pages
-
Basic QC Stastics
8 Pages
-
Commutability Guide
4 Pages
-
How to measure uncertainty
8 Pages
-
ISO 15189 Educational Guide
8 Pages
-
Troubleshooting QC Errors
8 Pages
-
Qnostics
52 Pages
-
Adiponectin LT519
28 Pages
-
Specific Proteins
40 Pages
-
Linearity sets
12 Pages
-
Antioxidants
16 Pages
-
Cardiology & Lipid Testing
28 Pages
-
Diabetes Portfolio
28 Pages
-
Total Bile Acids
4 Pages
-
VIVALYTIC
30 Pages
-
RANDOX DISCOVERY
36 Pages
-
HbA1c
2 Pages
-
Preparing QC
1 Pages
-
Point of Care Testing
12 Pages
-
LT394 Using QC Multirules
1 Pages
-
Guide to running QC
1 Pages
-
Tumour Marker Arrays
4 Pages
-
Which QC is the Right QC
8 Pages
-
How often is right for QC
6 Pages
-
Cardiac Risk Multiplex Array
4 Pages
-
LT241 Metabolic Array MAY15
8 Pages
-
KRAS / BRAF / PIK3CA Array*
4 Pages
-
Custom Arrays for Biochip
12 Pages
-
LT169 Cardiac Array
4 Pages
Archived catalogs
-
ACUSERA
108 Pages
-
Evidence Evolution
28 Pages
-
Evidence
16 Pages
-
Metabolic Syndrome Arrays
8 Pages
-
STI Multiplex Array
8 Pages
-
Molecular Testing
16 Pages
-
Evidence Investigator
20 Pages
-
Fertility Array
4 Pages
-
Rx Daytona
16 Pages
-
Evidence Investigator
16 Pages
-
Evidence
16 Pages


