Ocular Response Analyzer Clinical Applications

Ocular Response Analyzer Clinical Applications
The Ocular Response Analyzer (ORA) is a tool that allows clinicians to classify corneal conditions based on biomechanical properties rather than traditional geometrical measurements. This advancement aids in identifying individuals at risk of developing corneal pathologies before symptoms appear.
Corneal Hysteresis (CH) and Corneal Resistance Factor (CRF)
CH and CRF are critical metrics provided by the ORA. Studies show that eyes with corneal disorders have significantly lower CH and CRF values compared to normal eyes. These measurements are particularly useful in identifying conditions like forme fruste and pellucid marginal degeneration. Post-refractive surgery, significant reductions in CH and CRF are observed due to biomechanical changes, highlighting the importance of pre-operative assessments to prevent complications like ectasia.
Clinical Applications
The ORA provides unique waveforms and measurements that help in identifying existing and potential corneal pathologies. It also offers a Corneal-Compensated Intraocular Pressure (IOPCC) reading, which is less affected by corneal properties than traditional methods, ensuring more accurate IOP measurements, especially post-refractive surgery.
Glaucoma Management
Studies emphasize the importance of corneal information in glaucoma management. CH is a significant factor in assessing glaucoma risk and progression, more so than Central Corneal Thickness (CCT). The ORA's IOPCC measurement is less influenced by corneal properties, providing more reliable IOP readings than the Goldmann Applanation Tonometer (GAT).
Intraocular Pressure (IOP) Measurement
The ORA addresses the limitations of GAT, which is affected by corneal thickness and rigidity. By considering corneal biomechanical properties, the ORA provides more accurate IOP measurements, reducing the risk of misclassification in glaucoma diagnosis and management.
Conclusion
The Ocular Response Analyzer offers significant advancements in the assessment of corneal biomechanics, providing clinicians with powerful tools for early detection and management of corneal and glaucoma-related conditions.
Catalog excerpts
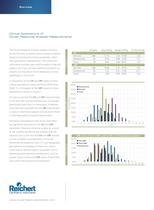
Cornea Clinical Applications of Ocular Response Analyzer Measurements for the first time, to classify various corneal conditions CH Normals Keratoconics based on biomechanical tissue properties, rather than geometrical measurements. This critical new information provides users with the ability to identify subjects who may not have traditional symptoms at Table 1 The Ocular Response Analyzer enables clinicians, N (eyes) Fuchs’ CRF Normals Keratoconics Fuchs’ present, but may be at risk of developing corneal pathologies in the future. Avg mmHg Range mmHg St Dev mmHg 246 62 11.19 8.74 7.24 - 15.80 4.80 - 12.39 1.63 1.17 24 8.41 3.60 - 10.37 1.73 246 62 24 10.46 7.12 7.83 5.37 - 15.74 2.21 - 11.58 4.76 - 10.59 1.75 2.11 1.23 A comparison of the CH and CRF values of three unique populations reveals significant differences 40.00 (Table 1). A histogram of the CRF values for these populations is shown in Figure 1. significantly lower than in normal eyes. In addition, it has been demonstrated that the CRF measurement is useful in identifying subjects who are forme fruste % population in the eyes with corneal disorders are, on average, 30.00 figure 1 It is easy to see that the CH and CRF measurements n Keratononus 35.00 n Normals n Fuchs’ 25.00 20.00 15.00 10.00 or who have pellucid marginal degeneration. 5.00 Numerous investigations have shown that there 0.00 are significant reductions in the CH and CRF 1 2 3 4 5 6 7 8 9 10 11 12 13 14 15 16 17 18 19 20 CRF parameters following refractive surgery as a result of the complex biomechanical changes that are induced. Due to the fact that CH and CRF provide CRF values of pre-LASIK, post-LASIK, and keratoconus subjects 25.00 biomechanical properties than CCT and topography, 20.00 n Post-LASIK pre-operative knowledge of these new metrics could help to identify subjects at greatest risk of developing post-operative complications, such as ectasia. Figure 2 shows the CRF values of pre-LASIK, post-LASIK and keratoconus populations. www.ocularresponseanalyzer.com figure 2 a more complete characterization of corneal 15.00 n Pre-LASIK n Keratoconus 10.00 5.00 0.00 1 2 3 4 5 6 7 8 9 10 11 12 13 14 15 16 17 18 19 20
Open the catalog to page 1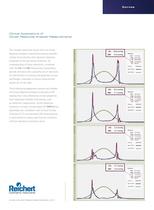
Cornea Clinical Applications of Ocular Response Analyzer Measurements References IOPcc: 11.6 mmHg IOPg: 10.9 mmHg The complex signal that results from the Ocular CH: 10.8 mmHg Response Analyzer measurement process provides CRF: 9.3 mmHg unique characteristics that represent signature CCT: 545 µM References IOPcc: 11.6 mmHg IOPg: 10.9 mmHg CH: 10.8 mmHg normal properties of the eye being measured. An understanding of these waveforms, combined with the CH and CRF measurement parameters, provide clinicians with a powerful set of new tools for identification of existing and potential corneal pathologies....
Open the catalog to page 2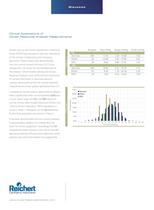
Glaucoma Clinical Applications of Ocular Response Analyzer Measurements Study (OHTS) have brought to light the importance CH Normals POAG of the cornea in diagnosing and managing glaucoma. These studies have demonstrated that thin central corneal thickness (CCT) is an independent risk factor for the development of Table 1 Studies such as the Ocular Hypertension Treatment the disease. Clinical studies utilizing the Ocular Response Analyzer have confirmed the importance N (eyes) Avg mmHg Range mmHg St Dev mmHg 246 62 11.19 10.08 7.24 - 15.80 2.07 - 19.96 1.63 2.32 24 8.82 6.80 - 11.59 1.39 246...
Open the catalog to page 3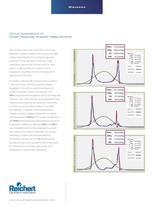
Glaucoma Clinical Applications of Ocular Response Analyzer Measurements References IOPcc: 11.6 mmHg The complex signal that results from the Ocular IOPg: 10.9 mmHg CH: 10.8 mmHg Response Analyzer measurement process provides 9.3 mmHg properties of the eye being measured. These CCT: 545 µM waveforms may provide clinicians with an even greater understanding of a subject’s risk of progression. Examples of various measurement normal unique characteristics that represent signature CRF: References IOPcc: 11.6 mmHg IOPg: 10.9 mmHg CH: 10.8 mmHg 9.3 mmHg CCT: Pressure: CRF: 545 µM Pressure: App no filter:...
Open the catalog to page 4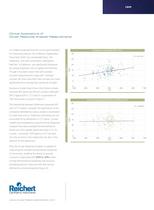
IOP Clinical Applications of Ocular Response Analyzer Measurements It is widely recognized that the current gold standard Goldmann-correlated IOP vs CCT for measuring pressure, the Goldmann Applanation 30 R2 = 0.1253 Tonometer (GAT), has considerable flaws. The 25 by corneal properties such as rigidity and thickness. Though it has been shown that GAT provides accurate measurements in eyes with “average” 20 IOPG “read like” a Goldmann, are significantly influenced figure 1 Goldmann, and other tonometers calibrated to 15 10 corneas, we now know that many corneas vary more 5 significantly from average...
Open the catalog to page 5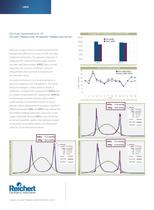
IOP Clinical Applications of Ocular Response Analyzer Measurements Average IOP in 28 eyes Pre- and Post-LASIK 20.00 n Pre-LASIK n Post-LASIK 16.00 12.00 Refractive surgery induces complex biomechanical 8.00 changes that affect the accuracy of GAT and other 4.00 traditional tonometers. The apparent reduction in 0.00 measured IOP in post-refractive surgery patients IOPG has been well documented. IOPCC takes corneal IOPcc Pre- and Post-LASIK properties into account, resulting in pressure 30 measurements that are more consistent with IOPcc mmHg pre-operative values. Accurate tonometery is of critical...
Open the catalog to page 6All Reichert catalogs and technical brochures
 Model 30™ Pneumatonometer
2 Pages
 Tono-Pen AVIA®
4 Pages
 Tono-Vera®
8 Pages
 ClearChart® 4
6 Pages
 Phoroptor® VRx
12 Pages
Archived catalogs
 Tono-Pen AVIA® Vet™
2 Pages
 Tono-Pen® Handheld Tonometers
10 Pages
 ML1
ML12 Pages
 Trial Lens Set & Trial Frame
2 Pages
 Tono-Pen®
10 Pages
 ClearChart® 4
6 Pages
 All-new for Fall 2016
4 Pages
 Ocular Response Analyzer® G3
12 Pages
 Foresee PHP ®
6 Pages
 TONO-PEN AVIA VET ?
32 Pages
 TONO-PEN VET?
2 Pages
 Ocular Response Analyzer
4 Pages
 Xcel® 455 Slit Lamp
2 Pages
 AP250
AP2502 Pages
 Reflex
2 Pages
 ClearChart® 3P Brochure
2 Pages
 AL700
AL7002 Pages
 ORA - Brochure
4 Pages
 iPac® Pachymeter
2 Pages
 PSL Portable Slit Lamp
2 Pages
 XCEL Slit Lamps Brochure
2 Pages
 PT100 Brochure
2 Pages
 Reichert 7CR - Brochure
2 Pages
 CT100/CT210 Brochure
2 Pages
 Tono-Pen AVIA Brochure
2 Pages
 Phoroptor®
4 Pages
 Tono-Pen Vet™
2 Pages


- Analysis software
- Tablet computer software
- Tablet PC software
- Windows software
- Fixed ophthalmic examination
- Treatment software
- Acquisition software
- Capture software
- Measurement software
- IPL system
- Test software
- Hand-held ophthalmic examination instrument
- Slit lamp
- EMR software
- Table slit lamp
- 3D software
- Mobile IPL system
- Refractometer ophthalmic examination
- Lens set