


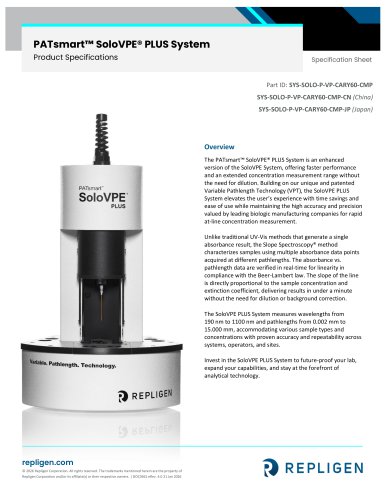
SoloVPE

SoloVPE
Abstract: This document discusses the determination of plasmid DNA purity ratios in human gene therapy products using Slope Spectroscopy with the SoloVPE instrument. Traditional methods using fixed-pathlength UV-Vis absorbance readings face challenges due to impurities in plasmid DNA. The SoloVPE offers a new method to accurately measure DNA purity ratios by overcoming these challenges.
Summary: Gene therapy offers potential solutions for genetic diseases, necessitating accurate DNA purity measurement. The 260/280 UV absorbance ratio, known as the R value, is used to assess DNA purity. Traditional spectrophotometers face issues with impurities like proteins and nucleic acids. The SoloVPE and its Slope Spectroscopy technique address these issues, providing reliable data by measuring absorbance at variable pathlengths.
Apparatus/Equipment: The document lists equipment used, including the SoloVPE Instrument, Cary 60, and various standards and reagents.
Method & Results: The R value is considered pure between 1.8 and 2.0. Stock solutions of plasmid DNA and protein were prepared and analyzed. The SoloVPE measured purity levels from 100% plasmid to 100% protein, with results showing high accuracy and reproducibility.
Analysis: Purity ratios were plotted against percent purity, showing good correlation with theoretical values. The SoloVPE software facilitated simultaneous measurements at 260 nm and 280 nm, automatically calculating the R value.
Conclusion: The SoloVPE improves sensitivity over traditional methods, providing a critical tool for DNA purity analysis in gene therapy. It offers immediate feedback and enhances the testing of challenging samples.
References: The document cites various studies and technical bulletins related to DNA purity measurement and gene therapy.
Catalog excerpts

APPLICATION NOTE 8*5 C Technologies, Inc. 9 A REPLIGEN COMPANY Author(s) Dawn M. Jones-Goldstein [email protected] 875 Chesterfield Parkway West Chesterfield, MO 63017 (636) 247-0127 Michael Jones [email protected] 875 Chesterfield Parkway West Chesterfield, MO 63017 (636) 247-2162 Sara Haydu [email protected] 685 Route 202/206 Bridgewater, NJ 08807 (908) 864-4972 Determination of Plasmid DNA Purity Ratio in Human Gene Therapy Products Using Slope Spectroscopy® Abstract Estimation of DNA purity in the presence of protein for gene therapy plasmid material is possible by exploiting the 260/280 UV absorbance ratio. This technique, however, has significant challenges when accurate quantification of DNA purity is required. The SoloVPE and its Slope Spectroscopy technique offer a new method to overcome these challenges, and to accurately measure DNA purity ratios in accordance with the Beer-Lambert law. DOC0178 Determination of Plasmid DNA Purity Ratio in Human Gene Therapy Products
Open the catalog to page 1
£ 8 # C Technologies, Inc A REPLIGEN COMPANY Gene therapy is an exciting opportunity to change the way genetic diseases are treated. It has the potential to provide a lifelong solution to unmet medical needs. For these purposes, DNA purity is examined by testing the ratio of absorbance at 260 nm and 280 nm. This ratio is also known as the R value. Nearly all traditional spectrophotometers rely on fixed-pathlength UV-Vis absorbance readings. Several issues can arise from using this method, especially when dealing with the impurities of plasmids. Common impurities in plasmid DNA (pDNA) include...
Open the catalog to page 2
APPLICATION NOTE Apparatus/Equipment SoloVPE Instrument, C Technologies, IN-VPE-SOLO5 ConfiRM Standard, 1.999 Abs/mm, CTechnologies catalog # MRM-PFI08-01-P10 ConfiRM Standard, 4.975 Abs/mm, CTechnologies catalog # MRM-PFI08-02-P10 ConfiRM Standard high, 23 Abs/mm, CTechnologies catalog # MRM-01-P1 Insulin, Sigma catalog # I0516-5ML Plasmid pCl-neo, project code 2019-1888, lot # MB2017459, Lake Pharma Plastic Sample Vessels OC0009-1-P50 Method & Results The R value is generally accepted as “pure” if the ratio is between 1.8 and 2.0. The ConfiRM standard was used to effectively demonstrate this...
Open the catalog to page 3
APPLICATION NOTE £ 8 # C Technologies, Inc. • A REPLIGEN COMPANY Stock solutions of 1.0 mg/mL pCI-neo DNA plasmid and 1.0 mg/mL bovine serum insulin protein were prepared by diluting with water. A spectral scan of the stock solutions were taken from 200 nm to 360 nm. The absorbance profiles are demonstrated in Figure 1. System suitability testing was done with the SoloVPE to verify stock concentration at 1.0 mg/mL. Extinction coefficients used were as follows: Plasmid DNA s260 nm= 20 (^£) Bovine serum insulin 8280 nm = 0.965 (^0 cm-1 After confirming that the stock solutions were at 1.0 mg/mL,...
Open the catalog to page 4
APPLICATION NOTE £ 8 # C Technologies, Inc. • A REPLIGEN COMPANY Table 1 (continued). Each purity level was analyzed by the SoloVPE. Triplicate slope measurements were obtained at 260 nm and 280 nm and averaged for a single reportable slope value. The R value was calculated for each level by slope ratio. Analysis The purity ratios obtained are plotted against their percent purity. The purity ratios obtained at each level correlate well with the theoretical ratio curve. The SoloVPE software provided the slope values at 260 nm and 280 nm simultaneously and then automatically calculated the ratio...
Open the catalog to page 5
APPLICATION NOTE £ 8 # C Technologies, Inc. • A REPLIGEN COMPANY Table 2. Purity ratio accuracy Calculating the purity ratio, a theoretical ratio was determined for each level. As the protein and DNA absorbance is non-interfering, the absorption of light by the combination of both chromophores is additive and may be calculated by using the following equation: Slope RatiOi = ^ Slope Ratio^yj • 9 represents the volume fraction, • j represents the components (i.e., DNA or protein), and • i represents the wavelengths (i.e., 260 or 280 nm). ••• ••• DOC0178 Determination of Plasmid DNA Purity Ratio...
Open the catalog to page 6
APPLICATION NOTE £ 8 # C Technologies, Inc. • A REPLIGEN COMPANY The theoretical and observed R values and percent error are compiled into Table 2. Of the 25 purity ratios obtained, the maximum observed error from theoretical was 1.56%. The average observed error was 0.25%. These results demonstrate a great accuracy and reproducibility at variety of purity ratios with a less than 2% deviation for all 25. Conclusion The current perception is that purity by UV 260/280 ratio is not useful, due to the availability of orthogonal assays with greater sensitivity. If values that exceed the typical variation...
Open the catalog to page 7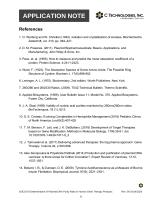
APPLICATION NOTE References 1. O. Warburg and W. Christian (1942). Isolation and crystallization of enolase. Biochemische Zeitschrift, vol. 310, pp. 384–421. 2. D. M. Prazeres. (2011). Plasmid Biopharmaceuticals: Basics, Applications, and Manufacturing. John Wiley & Sons, Inc. 3. Pace, et. al. (1995). How to measure and predict the molar absorption coefficient of a protein. Protein Science. 4:2411-2423. 4. Ward, F. (1923). The Absorption Spectra of Some Amino Acids: The Possible Ring Structure of Cystine. Biochem J. 17(6):898-902 6. Leninger, A. L. (1975). Biochemistry, 2nd edition. Worth Publishers,...
Open the catalog to page 8
APPLICATION NOTE £ 8 # C Technologies, Inc. W A REPLIGEN COMPANY 15. Standard Procedure for using ConfiRM® with the SoloVPE. (06 June 2018) DOC0138 Revision 00. C Technologies 16. Sawyer, Donald et. al. (1984) Chemistry experiments for instrumental methods. Wiley, New York. DOC0178 Determination of Plasmid DNA Purity Ratio in Human Gene Therapy Products
Open the catalog to page 9All Repligen catalogs and technical brochures
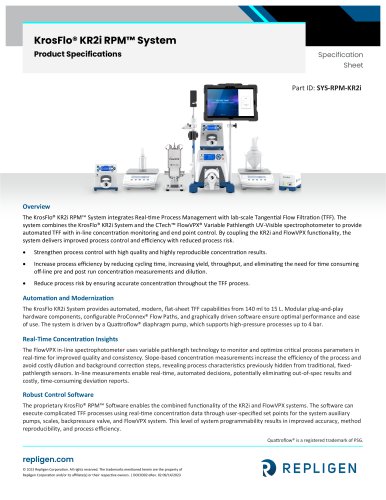
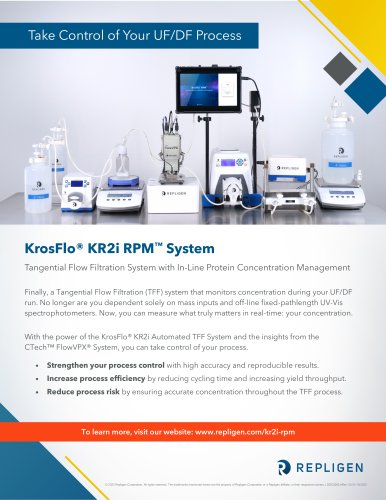
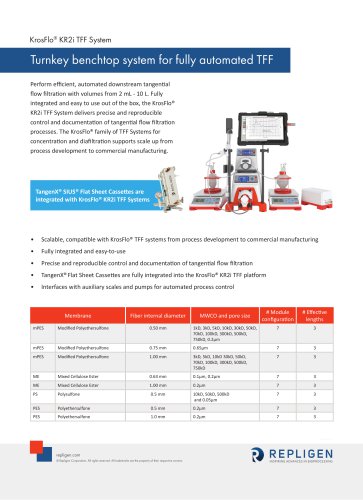 KrosFlo® KR2i TFF System
1 Page
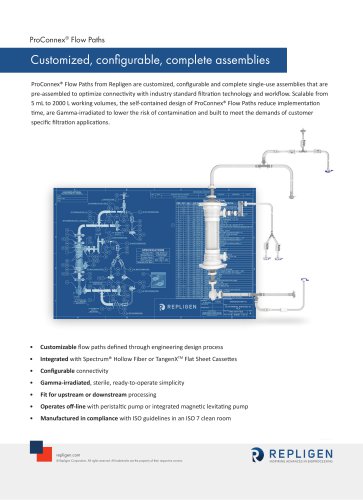 ProConnex® Flow Paths
1 Page
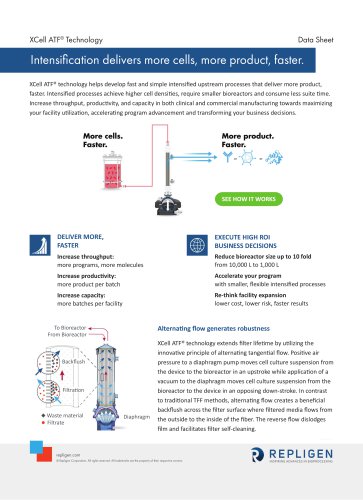 XCell ATF® Technology
2 Pages
Archived catalogs
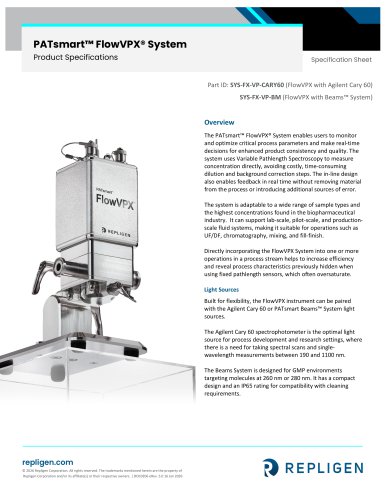
 FlowVPE
1 Page

- Analysis software
- Control software
- Laboratory testing system
- Reporting software
- Windows software
- Monitoring software
- Cloud-based software
- Medical device testing system
- Control analyser
- Data management software
- Measurement software
- Web-based software
- Test software
- Real-time software
- Data analysis software
- Testing system with touchscreen
- Benchtop spectrophotometer
- Continuous testing system
- Security software