Measuring drug effect on cell cycle profile using the Cellometer Vision image cytometer
1 /5Pages

Measuring drug effect on cell cycle profile using the Cellometer Vision image cytometer
1 /5Pages
Catalog excerpts
TECHNICAL NOTE Measuring drug effect on cell cycle profile using the Cellometer Vision image cytometer. Introduction Cell cycle analysis is a commonly used assay in both clinical diagnosis and biomedical research. This analysis distinguishes cells in different phases of cell cycle and is often used to determine cellular response to drugs and biological stimulations [1, 2]. Because this assay is based on measuring the DNA content in a cell population, it can also be used to analyze DNA fragmentation during apoptosis, requiring multicolor fluorescent staining of biomarkers and DNA [3]. Recently, a small desktop imaging cytometry system (Cellometer Vision) has been developed for automated cell concentration and viability measurement using brightfield (BR) and fluorescent (FL) imaging methods [4]. The system can perform rapid cell enumeration using disposable counting slides. The software utilizes a novel counting algorithm for accurate and consistent measurement of cell concentration and viability on a variety of cell types [5]. By developing fluorescent-based cell cycle assays, the Cellometer imaging cytometry can provide a quick, simple, and inexpensive alternative for biomedical research, which may be beneficial for smaller research laboratories and clinics. In this work, we demonstrate new applications of the Cellometer Vision for fluorescencebased cell population analysis as an alternative for flow cytometry. Cell cycle analysis was performed by inducing specific arrest in G0 /G1, S, and G2 /M phase of Jurkat cell population with aphidicolin, etoposide, and nocodazole, respectively [6-8]. The results were compared between the image-based and conventional flow cytometry meth
Open the catalog to page 1
Measuring drug effect on cell cycle profile using the Cellometer Vision image cytometer. Materials and methods Cellometer Vision and disposable counting chamber Cell preparation for cell cycle analysis The Cellometer Vision utilizes one brightfield and two The Jurkat cell line (TIB-152) was cultured in RPMI medium fluorescent channels to perform image-based cytometric with 10% fetal bovine serum. The cell culture was maintained analysis. Brightfield imaging used a broadband white light-emitting diode (LED) and fluorescence imaging used three different monochromatic LEDs (470, 527, and 630 nM)...
Open the catalog to page 2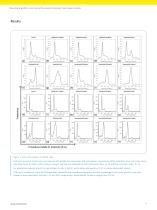
Measuring drug effect on cell cycle profile using the Cellometer Vision image cytometer. Propidium Iodide FL Intensity (R.U.) Figure 1: Cell cycle analysis of Jurkat cells. Cell cycle arrest of Jurkat cells was induced with aphidicoLin, etoposide, and nocodazole, respectively, at the indicated dose. Cell cycle arrest was determined by DNA content analysis using PI staining and analyzed by both Cellometer (Figs. 1a-1j) and flow cytometry (Figs. 1k-1t). For aphidicolin-induced arrest, the percentage of cells at G0/G1 and S phase increased by 2-3% in a dose-dependent manner. Cells were arrested...
Open the catalog to page 3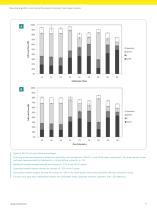
Measuring drug effect on cell cycle profile using the Cellometer Vision image cytometer. Figure 2: Plot of cell cycle phase percentages. Cell cycle arrest was induced by aphidicolin, etoposide, and nocodazole in G0/G1, S, and G2/M phase, respectively. The drug-induced Jurkat cells were measured with (A) Cellometer (n = 4) and (B) flow cytometry (n = 2). Aphidicolin-treated samples showed an increase of ~2-3% in the G0/G1 phase. Etoposide-treated samples showed an increase of ~10% in the S phase. Nocodazole-treated samples showed an increase of ~35% in the G2/M phase, which were consistent with...
Open the catalog to page 4
Measuring drug effect on cell cycle profile using the Cellometer Vision image cytometer. • The ability to rapidly and cost-effectively perform cell 1. Diermeier-Daucher, S., et al., Cell Type Specific population analysis may improve research efficiency, especially where a flow or laser scanning cytometer is Dynamic Proliferation Assessment in Flow Cytometry. not available or in situations where a rapid analysis of 2. Sena, G., et al., Measuring the complexity of cell cycle • Cellometer Vision performed the cell cycle assay arrest and killing of drugs: Kinetics of phasespecific outlined here and...
Open the catalog to page 5All Revvity catalogs and technical brochures
 Model 307 Sample Oxidizer
3 Pages


Archived catalogs
 chemagic 360 instrument
4 Pages
 chemagic Prepito® instrument
4 Pages


- Detection kit
- Solvent reagent
- Blood detection kit
- Molecular biology reagent
- Serum detection kit
- Immunoassay detection kit
- Plasma detection kit
- Research reagent
- Laboratory reagent
- Diagnostic reagent
- Infectious disease detection kit
- Molecular detection kit
- Optical test kit
- Clinical detection kit
- Sample preparation system
- Tablet computer software
- Tablet PC software
- Automatic sample processor
- Microtiter plate
- Fluorescence detection kit