
Catalog excerpts

SHIMADZU Excellence in Science Application Handbook
Open the catalog to page 1
The analysis of whole blood, plasma, serum and urine is a most insightful method in clinical research. Since the sensitivity of analytical instrumentations systems has improved steadily in recent years, research results and reliability have increased as well. In clinical applications, analytical instruments unfold a multitude of benefits: • hey support the quality of human life. The concentration T of medications in Therapeutic Drug Monitoring (TDM), is assured, even though this may change according to age and health conditions and is dependent on gender, genetic constitution or...
Open the catalog to page 2
Contents 1. Chromatography 1.1 Gas Chromatography 1.2 Liquid Chromatography 2. Mass Spectrometry 2.1 Gas Chromatography-Mass Spectrometry 2.2 Liquid Chromatography-Mass Spectrometry 3. Spectroscopy 3.1 Atomic Spectroscopy 3.1.1 Atomic Absorption Spectroscopy (AAS) 3.1.2 Energy Dispersive X-Ray Fluorescence (EDX) 3.1.3 Inductively Coupled Plasma Optical Emission Spectroscopy (ICP-OES) 3.2 Molecular Spectroscopy 3.2.1 Ultraviolet Visible Spectroscopy and Near Infrared (UV-VIS NIR) 3.2.2 Fourier Transform Infrared Spectroscopy (FTIR) 3.2.3 Fluorescence Spectroscopy 4. Life Science Lab...
Open the catalog to page 3
SHIMADZU Excellence in Science
Open the catalog to page 4
Chromatographic separation in gas phase for analysis of volatile and semi volatile components is used in clinical field since many years. Gas chromatography is a key technique for quantitative analysis of alcohol in blood. LAAN-J-GC-E012 Analysis of alcohol compounds in blood (1) LAAN-J-GC-E013 Analysis of alcohol compounds in blood (2)
Open the catalog to page 5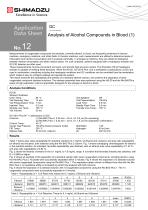
Application Data Sheet GC Gas Chromatography Analysis of Alcohol Compounds in Blood (1) 85 °C 15 min. 1 min. 0.5 min. 150 °C 20 mL Vial Agitation: Off Needle Flash Time: 0.5 min. Transfer Line Temp.: 150 °C Measurements of oxygenated compounds and alcohols, primarily ethanol, in blood, are frequently performed in forensic medicine, emergency medicine, and other fields. In forensic medicine, such measurements are utilized to determine levels of intoxication from alcohol consumption and to evaluate criminality. In emergency medicine, they are utilized to distinguish between alcohol...
Open the catalog to page 6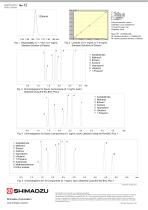
Y = aX + b a = 1.553005e-006 b = 1 974794e-002 FT2 = 0.9999422 R = 0.9999711 External standard method Calibration curve: Straight line Through the origin: No Weighting: None Mean RF: 1.674826e-006 RF standard deviation: 1.019928e-007 RF relative standard deviation: 6.089755 Fig. 2 Linearity of 0.1 mg/mL to 1.6 mg/mL Standard Solutions of Ethanol Fig. 4 Chromatograms for Seven Components (0.1 mg/mL each) Obtained Using the Rtx-BAC Plus 1 Fig. 5 Chromatograms for 10 Components (0.1 mg/mL each) Obtained Using the Rtx-BAC Plus 1 First Edition: October 2013 SHIMADZU Shimadzu Corporation...
Open the catalog to page 7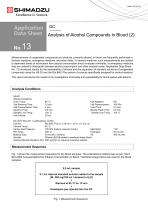
Application Data Sheet GC Gas Chromatography Analysis of Alcohol Compounds in Blood (2) Measurements of oxygenated compounds and alcohols, primarily ethanol, in blood, are frequently performed in forensic medicine, emergency medicine, and other fields. In forensic medicine, such measurements are utilized to determine levels of intoxication from alcohol consumption and to evaluate criminality. In emergency medicine, they are utilized to distinguish between alcohol consumption and other medical cases. Application Data Sheet No. 12 introduced results for the repeatability of ethanol and the...
Open the catalog to page 8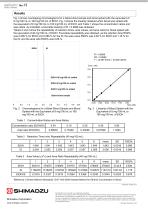
Results Fig. 2 shows overlapping chromatograms for a blank blood sample and blood spiked with the equivalent of 8 mg/100 mL to 160 mg/100 mL of EtOH. Fig. 3 shows the linearity obtained when blood was spiked with the equivalent of 8 mg/100 mL to 160 mg/100 mL of EtOH, and Table 1 shows the concentration ratios and area ratios. As indicated, a favorable linearity of R = 0.9999 was obtained. Tables 2 and 3 show the repeatability of retention times, area values, and area ratios for blood spiked with the equivalent of 40 mg/100 mL of EtOH. Favorable repeatability was obtained, as the retention...
Open the catalog to page 9
1. Chromatography1.2 Liquid Chromatography HPLC and UHPLC systems are able to quantitatively analyze substances in blood, serum, plasma and urines containing multiple compounds by separating and detecting target substances. Shimadzu offers a wide variety of application-specific systems, such as automated sample pretreatment systems for amino acid analysis or on-line sample trapping for quantification of drugs or metabolites. High speed analysis of delta-aminolevulinic acid High-speed, sensitive analysis of serotonin Ultra-fast, high-sensitivity analysis of degradation products in...
Open the catalog to page 10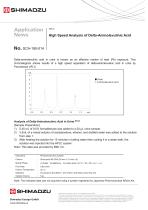
SHIMADZU Application News NO. SCA-190-014 Delta-aminolevulinic acid in urine is known as an effective marker of lead (Pb) exposure. This chromatogram shows results of a high speed separation of delta-aminolevulinic acid in urine by Prominence UFLC. Analysis of Delta-Aminolevulinic Acid in Urine [Note] [Sample Preparation] 1) 0.45 mL of 8.5% formaldehyde was added to a 20 pL urine sample. 2) 3.5mL of a mixed solution of acetylacetone, ethanol, and distilled water was added to the solution from step 1. 3) After heating the solution for 15 minutes in boiling water then cooling it in a water...
Open the catalog to page 11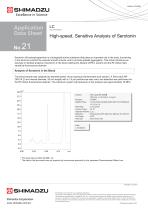
Data Sheet High-speed, Sensitive Analysis of Serotonin no.21 Serotonin (5-hydroxytryptamine) is a biologically active substance that plays an important role in the body, functioning in the blood to constrict the vascular smooth muscle, and to promote platelet aggregation. This article introduces an example of ultrafast analysis of serotonin in the blood utilizing the Nexera UHPLC system and the RF-20Axs high-sensitivity fluorescence detector. Analysis of Serotonin in the Blood The blood sample was subjected to deproteinization via an aqueous trichloroacetic acid solution. A Shim-pack XR-ODS...
Open the catalog to page 12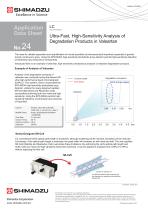
Data Sheet No.24 Ultra-Fast, High-Sensitivity Analysis of Degradation Products in Valsartan The need for reliable separation and quantification of minute quantities of pharmaceutical impurities suspected of genetic toxicity continues to grow. Using the SPD-M30A high-sensitivity photodiode array detector permits high-sensitivity detection of extremely trace amounts of components. Introduced here is an example of ultra-fast, high-sensitivity simultaneous analysis of valsartan degradation products. Example of Analysis of Valsartan Column Mobile Phase Flow Rate Column Temp. Injection...
Open the catalog to page 13All Shimadzu catalogs and technical brochures
-
RADspeed Pro EDGE
5 Pages
-
UV-1900i
4 Pages
-
LCMS-9030
12 Pages
-
LCMS-8050
20 Pages
-
LCMS-8045
12 Pages
-
XRD-6100
32 Pages
-
EDX-LE
16 Pages
-
PDA-8000
16 Pages
-
AA-6200
12 Pages
-
UV-3600i Plus
20 Pages
-
SPM-9700HT
27 Pages
-
SALD-2300
20 Pages
-
IG-1000 Plus
16 Pages
-
DSC-60 Plus Series
8 Pages
-
TOC process analysis
16 Pages
-
MB140
4 Pages
-
GC Column Guidebook
48 Pages
-
ATX/ATY Series
6 Pages
-
MOC63u
2 Pages
-
MOC-120H
4 Pages
-
MOC63u
8 Pages
-
UW/UX Series
4 Pages
-
New products 1
1 Pages
-
New products
1 Pages
-
BL series
2 Pages
-
BW-K/BX-K
2 Pages
-
TX/TXB/TXC Series
8 Pages
-
HMV- 2 brochure
8 Pages
-
AutographA G - XSeries
20 Pages
-
Solutions Brochure
24 Pages
-
PSSM - 8 System
8 Pages
-
MOC-120H
4 Pages
-
AUW-D / AUW / AUX / AUY
8 Pages
Archived catalogs
-
MOC63U Flyer
2 Pages
-
ATX/ATY Series_2013
4 Pages
-
UW/UX Series
4 Pages
-
SALD-7101
16 Pages
-
MOC63U
6 Pages


