
Catalog excerpts

Single Nano Particle Size Analyzer
Open the catalog to page 1
Voyaging into the Single Nano Region
Open the catalog to page 2
I G- 100 0 P lus Si ngl e N a n o P a r t i c l e S i z e An a ly ze r High-Sensitivity Analysis of Single Nano Particles The IG-1000 Plus measures optical signals from a diffraction grating formed by the particles, rather than scattered light being emitted by the particles. This means that even in the single nano region, a sufficient S/N ratio can be obtained and stable measurement with good reproducibility is possible. In addition, the IG-1000 Plus can achieve a sensitivity 10 times higher than the IG-1000. Resistance to Contamination The new measurement principle is resistant to...
Open the catalog to page 3
Beyond the Single Nano Region and Into the Sub-Nano Region The IG-1000 Plus Single Nano Particle Size Analyzer The IG-1000 Plus uses the induced grating (IG) method, which is based on a new principle for measuring the size of nano particles using the phenomenon of dielectrophoresis and diffracted light. The conventional method measures the light scattered by particles, but this decreases sharply for particle sizes of less than 100 nm. Furthermore, in the single nano region (i.e. particle sizes of less than 10 nm), there are physical restrictions that make it difficult to detect scattered...
Open the catalog to page 5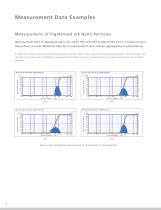
Measurement Data Examples M eas ur eme n t o f P i g m e n t ed In k Na n o P a rticle s Nano particles tend to aggregate easily, but when they are used as pigmented inks it is important that they remain in a well-dispersed state for a long period of time without aggregating or precipitating. It is difficult for light to pass through highly-absorbent particles. With a short optical path cell (special accessory), which decreases the absorption of samples, the IG-1000 Plus overcomes this restriction, making it a powerful tool for quality control in the ink and paint industries. Particle size...
Open the catalog to page 6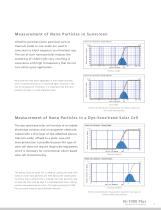
M eas ur em e n t o f N a n o P a rticle s in S u n scre e n Ultrafine particles (nano particles) such as titanium oxide or zinc oxide are used in sunscreen to block exposure to ultraviolet rays. The use of such nano particles reduces the scattering of visible light rays, resulting in sunscreens with high transparency that do not turn white upon application. Titanium Oxide Nano particles may easily aggregate to form larger particles, which increase the amount of scattered light, resulting in the loss of transparency. Therefore, it is important that the nano particles are kept in a...
Open the catalog to page 7
F ur t her D a t a E x a m p l e s The following data was obtained by analyzing various sample particle groups of various sizes with the IG-1000 Plus. Fullerene hydroxide, an example of a substance in the single nano region, can be analyzed with high reproducibility. Particle Size Distribution (Volumetric Basis) Normalized Particle Amount Fullerene Hydroxide Particle Diameter (nm) (Sample provided by Prof. Kokubo of Osaka University) Even with samples containing a wide range of particle sizes, there is no bias toward larger particles, and the existence of smaller particles is accurately...
Open the catalog to page 8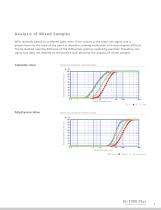
Anal ys i s o f Mi x e d S a m p l es With methods based on scattered light, even if the volume is the same, the signal size is proportional to the cube of the particle diameter, making evaluation of mixed samples difficult. The IG method uses the diffusion of the diffraction grating created by particles; therefore, the signal size does not depend on the particle size, allowing the analysis of mixed samples. Particle Size Distribution (Volumetric Basis) Normalized Particle Amount Colloidal silica Particle Size Distribution (Volumetric Basis) Normalized Particle Amount Polystyrene latex...
Open the catalog to page 9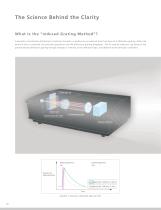
The Science Behind the Clarity What I s t h e " I n d u c e d G r a tin g Me th o d " ? A periodic concentration distribution of particles formed in a medium by an external force functions as a diffraction grating. When the external force is removed, the particles spread out and the diffraction grating disappears. The IG method measures the decay of the particle density diffraction grating through changes in intensity of the diffracted light, and determines the diffusion coefficient. Batch cell Semiconductor laser Condensing lens Optical detector Intensity of diffracted light Large...
Open the catalog to page 10
Diffraction Grating Formed by Dielectrophoresis An alternating voltage is applied to cyclically arranged electrodes, and a cyclic concentration distribution of microscopic particles is formed in the liquid by dielectrophoresis. Although the cyclic concentration distribution of microscopic particles acts as a diffraction grating, if the alternating voltage is stopped, the grating diffuses and disappears (Patent No. 4375576). Optical detector Diffracted light created by particles Diffracted light created by electrodes Optical detector -Precision Measurement By Changing Electrode...
Open the catalog to page 11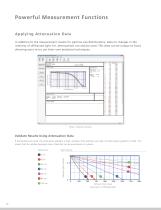
Powerful Measurement Functions A ppl yi ng A t t e n u a t i o n D a ta In addition to the measurement results for particle size distributions, data on changes in the intensity of diffracted light (i.e. attenuation) can also be used. This data can be output to Excel, allowing users to try out their own analytical techniques. Validate Results Using Attenuation Data If the particles are small, the attenuation gradient is high, whereas if the particles are large, the attenuation gradient is small. This means that the relative (average) sizes of particles can be ascertained at a glance....
Open the catalog to page 12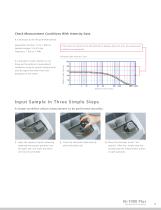
Check Measurement Conditions With Intensity Data It is necessary to set the parameters below. Application duration: 10 to 1,000 ms Applied voltage: 5 to 35 Vpp Frequency: 1 kHz to 1 MHz If the maximum intensity of the diffracted light is between these two lines, the measurement conditions are appropriate. It is possible to check whether or not these are the optimum measurement conditions using the optical intensity level and the upper and lower limit lines displayed on the screen. Relative Light Intensity Diffracted Light Intensity Check Diffusion Time (msec) I np u t Sam ple In Thr ee Si m...
Open the catalog to page 13All Shimadzu catalogs and technical brochures
-
RADspeed Pro EDGE
5 Pages
-
UV-1900i
4 Pages
-
LCMS-9030
12 Pages
-
LCMS-8050
20 Pages
-
LCMS-8045
12 Pages
-
XRD-6100
32 Pages
-
EDX-LE
16 Pages
-
PDA-8000
16 Pages
-
AA-6200
12 Pages
-
UV-3600i Plus
20 Pages
-
SPM-9700HT
27 Pages
-
SALD-2300
20 Pages
-
DSC-60 Plus Series
8 Pages
-
TOC process analysis
16 Pages
-
MB140
4 Pages
-
GC Column Guidebook
48 Pages
-
ATX/ATY Series
6 Pages
-
MOC63u
2 Pages
-
MOC-120H
4 Pages
-
MOC63u
8 Pages
-
UW/UX Series
4 Pages
-
Application Handbook Clinical
140 Pages
-
New products 1
1 Pages
-
New products
1 Pages
-
BL series
2 Pages
-
BW-K/BX-K
2 Pages
-
TX/TXB/TXC Series
8 Pages
-
HMV- 2 brochure
8 Pages
-
AutographA G - XSeries
20 Pages
-
Solutions Brochure
24 Pages
-
PSSM - 8 System
8 Pages
-
MOC-120H
4 Pages
-
AUW-D / AUW / AUX / AUY
8 Pages
Archived catalogs
-
MOC63U Flyer
2 Pages
-
ATX/ATY Series_2013
4 Pages
-
UW/UX Series
4 Pages
-
SALD-7101
16 Pages
-
MOC63U
6 Pages


