
Catalog excerpts

UV-VIS-NIR Spectrophotometer
Open the catalog to page 1
L e a d i n g t h e Wa y to New Solutions Perfect for a Wide Variety of Applications Spectral evaluation functionality enables unique pass/fail judgments for quality control. During measurements, data can be automatically sent to Excel ® in real time for using macros to automatically obtain desired values. Highest Sensitivity in Class with Three Detectors This model includes a photomultiplier tube (PMT) detector for the ultraviolet-to-visible light region and InGaAs and cooled PbS detectors for the near-infrared region. A multipurpose large sample compartment and an integrating sphere with...
Open the catalog to page 2
H i ghe st S e n si ti vity in C la ss with Thr e e D e te c to rs The UV-3600i Plus provides precise transmittance or reflectance measurements in the ultraviolet to near-infrared regions. The level of sensitivity in the near-infrared region is significantly enhanced by using the combination of an InGaAs detector and a cooled PbS detector for this region. Spectra can be obtained without interruption for the entire range, with a high level of sensitivity and precision. InGaAs detector PMT Optical system around detectors PMT detector Relative Value Conventional spectrophotometers use a PMT...
Open the catalog to page 4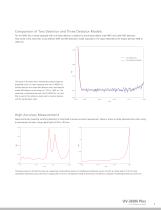
Comparison of Two Detector and Three Detector Models The UV-3600i Plus is newly equipped with an InGaAs detector in addition to the photomultiplier tube (PMT) and cooled PbS detectors. That results in less noise than a two-detector (PMT and PbS detectors) model, especially in the region detected by the InGaAs detector (900 to 1600 nm). UV-3600i Plus Two-Detector Model The figure on the right shows transmittance spectra (spectral bandwidth 2nm) for water measured with the UV-3600i Plus (InGaAs detector and cooled PbS detector) and a two-detector model (PbS detector) in the range of 1,370 to...
Open the catalog to page 5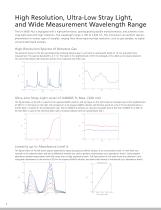
High Resolution, Ultra-Low Stray Light, and Wide Measurement Wavelength Range The UV-3600i Plus is equipped with a high-performance, grating-grating double monochromator, and achieves a low stray-light level with high resolution. The wavelength range is 185 to 3,300 nm. This instrument can perform spectrophotometry for various types of samples, ranging from those requiring high resolution, such as gas samples, to highly concentrated liquid samples. High-Resolution Spectra of Benzene Gas The spectrum shown on the left was obtained by enclosing benzene gas in a cell with an optical-path...
Open the catalog to page 6
Covers a Wide Wavelength Range from Ultraviolet to Near-Infrared The wavelength range of 185 to 3,300 nm enables measurement over the ultraviolet, visible, and near-infrared regions. In addition, the acquired spectra exhibit little noise across the entire range. The figure on the right shows a spectrum obtained by measuring toluene in the range of 185 to 3,300 nm using a cell with an optical path length of 2 mm. Spectra in the ultraviolet, visible, and near-infrared regions can be obtained. The figure on the right shows the spectrum for a low-transmittance film on a silica wafer in the...
Open the catalog to page 7
Extensive Selection of Application Programs for a Wide Variety of Applications Electrical, Electronics, and Optics High-absorbance measurement of polarizing films Reflection measurement of multilayer films Absolute reflectance measurement of highly reflective mirrors Spectral characteristic measurement of beam splitters Relative emission measurement of LEDs Transmittance measurement of quartz plates Absolute reflectance measurement of anti-reflection coatings Transmittance measurement of functional films Diffuse reflectance measurement and band gap measurement of semiconductor materials...
Open the catalog to page 8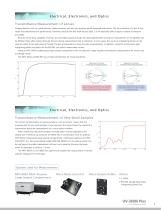
E le ctrica l, Elec tronic s, and Optic s Transmittance Measurement of Lenses Imaging devices, such as mobile phones, digital cameras, and security cameras, are all equipped with lenses. The transmittance of a lens is one factor that determines lens performance. However, because the lens itself focuses light, it is an especially difficult type of sample to measure accurately. Because of the focal capability of lenses, the total light passing through the spectrophotometer during the measurement of the baseline can be different than after passing through the lens during measurement due to...
Open the catalog to page 9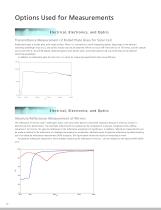
Options Used for Measurements E le ctrica l, Elec tronic s, and Optic s Transmittance Measurement of Rolled Plate Glass for Solar Cell Rolled plate glass is a plate glass with rough surface. When it is scanned by a small integrating sphere, large steps at the detector switching wavelength may occur, and correct results may not be obtained. When run by an ISR-1503 with an of 150 mmø, and the sample was turned with 0, 45 and 90 degree, obtained spectra were almost same. And those spectra had very small steps at the detector switching wavelength. In addition to rolled plate glass for solar...
Open the catalog to page 10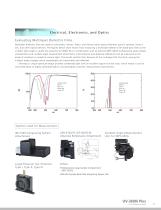
E le ctrica l, Elec tronic s, and Optic s Evaluating Multilayer Dielectric Films Multilayer dielectric films are used to coat lenses, mirrors, filters, and various other optical elements used in cameras, binoculars, and other optical devices. The figures below show results from measuring a multilayer dielectric film band-pass filter as the incident light angle is varied. By using the UV-3600i Plus in combination with an optional MPC-603A multipurpose large sample compartment and variable angle measurement attachment, transmittance and absolute reflectance can be measured as the angle of...
Open the catalog to page 11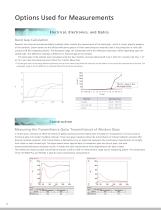
Options Used for Measurements Ele ctrica l, Elec tronic s, and Optic s Band Gap Calculation Research into solar-cell and photocatalytic materials often involves the measurement of the band gap*, which is a basic physical property of the materials. Shown below are the diffuse reflectance spectra of three semiconductor materials used in the production of solar cells using the ISR-603 integrating sphere. The absorption edge, the wavelength where the reflectance decreases, differs depending upon the sample type. This difference indicates a difference in the band gap of the samples. The band...
Open the catalog to page 12All Shimadzu catalogs and technical brochures
-
RADspeed Pro EDGE
5 Pages
-
UV-1900i
4 Pages
-
LCMS-9030
12 Pages
-
LCMS-8050
20 Pages
-
LCMS-8045
12 Pages
-
XRD-6100
32 Pages
-
EDX-LE
16 Pages
-
PDA-8000
16 Pages
-
AA-6200
12 Pages
-
SPM-9700HT
27 Pages
-
SALD-2300
20 Pages
-
IG-1000 Plus
16 Pages
-
DSC-60 Plus Series
8 Pages
-
TOC process analysis
16 Pages
-
MB140
4 Pages
-
GC Column Guidebook
48 Pages
-
ATX/ATY Series
6 Pages
-
MOC63u
2 Pages
-
MOC-120H
4 Pages
-
MOC63u
8 Pages
-
UW/UX Series
4 Pages
-
Application Handbook Clinical
140 Pages
-
New products 1
1 Pages
-
New products
1 Pages
-
BL series
2 Pages
-
BW-K/BX-K
2 Pages
-
TX/TXB/TXC Series
8 Pages
-
HMV- 2 brochure
8 Pages
-
AutographA G - XSeries
20 Pages
-
Solutions Brochure
24 Pages
-
PSSM - 8 System
8 Pages
-
MOC-120H
4 Pages
-
AUW-D / AUW / AUX / AUY
8 Pages
Archived catalogs
-
MOC63U Flyer
2 Pages
-
ATX/ATY Series_2013
4 Pages
-
UW/UX Series
4 Pages
-
SALD-7101
16 Pages
-
MOC63U
6 Pages


