- Catalogs
- SoftGenetics, LLC.
- Mutation Surveyor®
Mutation Surveyor®
1 /16Pages

Mutation Surveyor®
1 /16Pages
Catalog excerpts

Fast, Accurate and Sensitive DNA Variant Detection from Sanger Sequencing: • Patented, Anti-Correlation Technology Provides • Variant Knowledge Base and External Annotation ► Variants, Artifacts and Positions of Significance • Compatible with output from all major capillary • sequencing systems and chemistries Detects all DNA Variants ► SNPs, INDELs, Mosaic, Hyper variable Chromosomal Position • Low Frequency Variant Detection and Quantification • Automatic Deconvolution of Heterozygous INDELs • Mitochondrial Sequence Analysis • Methylation Sequence Analysis • Displays Variant Nomenclature in Varied Formats • • User Login and Audit trail capable Pipeline Automation ► Analyze up to 2000 traces in minute
Open the catalog to page 1
Mutation Surveyor® Software combines both automation and accurate variant calling into a single easy-to-use analysis package. The software is compatible with all major capillary electrophoresis systems, allowing for an integrated workflow from importing of raw data to analysis and reporting. The patented anti-correlation technology (US patent 8,086,401) physically compares sample sequence traces to a reference trace, calculating dropping factor, overlapping factor, peak height and signal to noise ratio of each individual peak, providing accuracy up to 99.5% with Phred 20 bi-directional sequences...
Open the catalog to page 2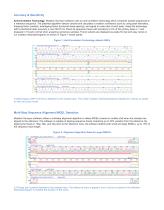
Accuracy & Sensitivity Anti-Correlation Technology: Mutation Surveyor software uses an anti-correlation technology which compares sample sequences to a reference sequence. The patented algorithm detects variants and calculates a mutation confidence score by using peak intensities, dropping factor (vertical), overlapping factor (horizontal base spacing), and signal to noise ratio of each peak. Using this technology with bi-directional data, accuracy is over 99.5% for Phred 20 sequence traces with sensitivity to 5% of the primary peak or 1 part diseased in 19 parts normal when analyzing cancerous...
Open the catalog to page 3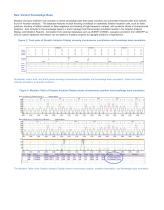
New Variant Knowledge Base Mutation Surveyor software now includes a variant knowledge base that easily monitors and automates frequent edits and variants found in mutation analysis. The database features include tracking of artifacts or repeatedly deleted mutation calls, such as false positives, tracking of added variants or false negatives and tracking of high frequency variants, with positions stored in chromosomal locations. Also included in the knowledge base is a track manager tool that provides annotated results in the Graphic Analysis Display and Mutation Reports. Annotation from external...
Open the catalog to page 4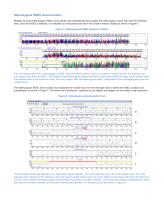
Heterozygous INDEL Deconvolution Mutation Surveyor Heterozygous INDEL Deconvolution tool automatically deconvolutes the heterozygous mutant trace from the wild-type trace. Once the INDEL is detected, it is indicated by a horizontal brown bar in the Graphic Analysis Display as shown in Figure 5. Figure 5: Heterozygous INDEL Sequence Pattern This is a typical pattern for a heterozygous INDEL. After the INDEL position, there is a pattern of double traces, one wild-type and one mutant trace with the INDEL. The Mutation Electropherogram shows that there is less noise within the region of the sample...
Open the catalog to page 5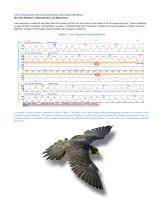
Low Frequency Variant Detection and Quantification (Somatic Mutation, Heteroplasmy, and Mosaicism) Low Frequency variations are often difficult to detect as they can be buried in the baseline of the sequence trace. These mutations include somatic mutations, heteroplasmy (usually in mitochondria) and mosaicism. Mutation Surveyor software contains a special algorithm to detect and display these possible low frequency variations. Figure 7: Low Frequency Variant Detection A possible somatic mutation detected in the tp53 gene. The green bar in the mutation electropherograms indicates the position...
Open the catalog to page 6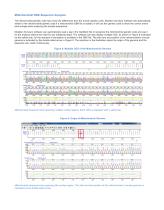
Mitochondrial DNA Sequence Analysis The mitochondrial genetic code has a few key differences from the human genetic code. Mutation Surveyor software will automatically switch to the mitochondrial genetic code if a mitochondrial GBK file is loaded. It will use this genetic code to show the correct amino acid change when analyzing the sample sequences. Mutation Surveyor software can automatically read a tag in the GenBank file to recognize the mitochondrial genetic code and use it for the analysis without the need for any additional steps. The software can also display multiple CDS, as shown in...
Open the catalog to page 7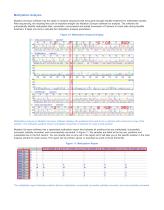
Methylation Analysis Mutation Surveyor software has the option to analyze sequences that have gone through bisulfite treatment for methylation studies. After sequencing, the resulting files can be imported straight into Mutation Surveyor software for analysis. The software will automatically identify methylated sites, successful, unsuccessful and partial conversion of Cytosine to Uracil sites during bisulfite treatment. It takes one click to activate the methylation analysis parameters. Figure 10: Methylation Analysis Display Methylation analysis in Mutation Surveyor software displays the positions...
Open the catalog to page 8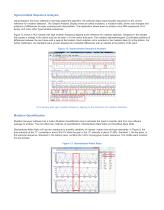
Hypervariable Sequence Analysis Using Mutation Surveyor software’s multi-step alignment algorithm, the software aligns hypervariable sequences to the correct reference for mutation detection. The Graphic Analysis Display shows all called mutations, a mutation table, amino acid changes and positions of differences for easy reviewing and interpretation. This application allows users to analyze virus DNA sequences, HLA typing, and many other hypervariable sequences. Figure 12 shows a HCV sample with high mutation frequency aligning to the reference for mutation detection. Variations in the sample...
Open the catalog to page 9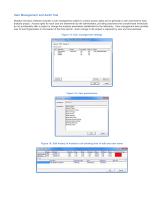
User Management and Audit Trail Mutation Surveyor software includes a user management system to control access rights and to generate a user audit trail for each analysis project. Access rights for each user are determined by the administrator, providing assurance that unauthorized individuals do not accidentally alter a project or change the analysis parameters established by the laboratory. User management also provides user ID and Organization in the header of the final reports. Each change to the project is captured by user and time stamped. Figure 14: User management settings Figure 15:...
Open the catalog to page 10All SoftGenetics, LLC. catalogs and technical brochures
 GeneMarker®
16 Pages
 ChimerMarker®
8 Pages
 MaSTR software
12 Pages

- Analysis software
- Visualization software
- Control software
- Laboratory software
- Reporting software
- Monitoring software
- Automated software
- Design software
- Acquisition software
- Traceability software
- Training software
- Import software
- Server software
- Research software
- Interpretation software
- Validation software
- Molecular biology software
- Genetic software
- NGS sequencing software
- NGS software