SA3800
1 /18Pages

SA3800
1 /18Pages
Catalog excerpts
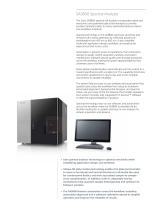
SA3800 Spectral Analyzer The Sony SA3800 spectral cell analyzer incorporates advanced electronics and patented optical technologies to provide excellent analytical data. Its many automated features deliver true workflow simplicity. Spectral technology in the SA3800 optimizes sensitivity and enhances dim signal detection by collecting photons at wavelengths from 420 nm to 800 nm. It also simplifies multicolor application design, workflow, and analysis for experienced and novice users. Automation is present across all operations, from instrument startup, to quality control, acquisition, analysis,...
Open the catalog to page 2
SA3800 System Overview The SA3800 spectral analyzer improves sensitivity and simplifies application design, workflow, and analysis over conventional flow cytometers. This is achieved using spectral analysis technology, automation throughout the system, advanced electronics, and patented optical technologies, unique to Sony systems. Supports up to 4 lasers including the 488-nm (blue) excitation laser that is standard in all systems. The 405-nm (violet), 561-nm (yellow-green), and 638-nm (red) lasers are available as options. The Flowpoint™ detection system precisely tracks the core stream shape...
Open the catalog to page 3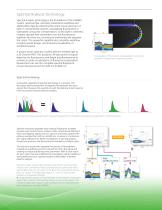
Spectral Analysis Technology Spectral analysis technology is the foundation of the SA3800 system. Spectral flow cytometry streamlines workflow and yields better data by collecting the entire visual spectrum of light. In conventional systems, overlapping fluorescence is subtracted using color compensation, so less light is collected. Instead, spectral flow cytometers sum the fluorescence together and then use unmixing to mathematically separate the colors. This powerful capability also simplifies workflow, including panel design, and improves visualization of autofluorescence. A unique prism collection...
Open the catalog to page 4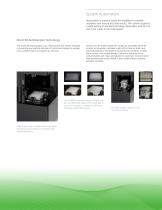
System Automation Automation is present across the workflow to simplify operation and ensure accurate results. The system supports a wide variety of standard and deep-well plates, and 12 x 75mm 5-mL tubes in the tube loader. Novel 3D AutoSampler Technology The novel 3D AutoSampler uses a fixed probe and moves the plate in horizontal and vertical directions to minimize sample-to-sample cross-contamination and speed up cleaning. Sensors on the probe enable the system to accurately move the sample to the probe, calculate height of the tube or plate, and automatically recoil the probe if it touches...
Open the catalog to page 5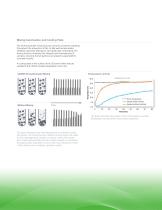
Mixing Automation and Cooling Plate The 3D AutoSampler mixing function ensures consistent sampling throughout the acquisition of 96- or 384-well sample plates. Software optimizes settings for each plate type. Importantly, the mixing function maintains the integrity and heterogeneity of samples, ensuring that all particles are properly suspended for consistent results. A cooling plate at the surface of the 3D base further reduces variability and inhibits sample degradation over time. A3800 A3800 D mixing D mixing 3800 A3800 mixing nventional onventional xing xing onventional nventional mixing...
Open the catalog to page 6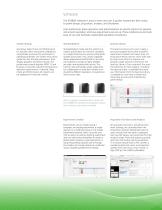
The SA3800 software is easy to learn and use. It guides researchers from setup to panel design, acquisition, analysis, and shutdown. User preferences allow operators and administrators to specify options for general instrument operation and how experiments are set up. These preferences promote ease of use and facilitate unattended operation procedures. At startup, Align Check and Performance QC wizards check instrument calibrations, using beads to ensure the instrument is operating optimally. On-screen instructions guide the user through procedures, then display progress and report results. The...
Open the catalog to page 7
Spectral Overlays To enable walk-away operation, the Event Checker monitors stream integrity to identify air bubbles or low event rates that might be produced by clogs. When an issue is identified, the Event Checker preferences can be set to either clear the clog and stop, or clear the clog and continue to the next sample. A tube/well map shows which tube or well had the issue. In conventional flow cytometry, cellular autofluorescence produced by pyridine (NAD/NADH), flavin (FMN, FAD), and other intracellular oxidative reactions can cause fluorescence signal contamination in, for example, the...
Open the catalog to page 8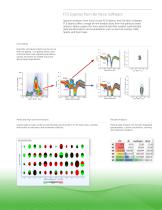
Spectral analyzers from Sony include FCS Express, from De Novo Software. FCS Express offers a range of new analysis tools from live gating to batch analysis. Native support for Sony spectral data files enables sophisticated data transformations and visualizations such as spectral overlays, tSNE, Spade, and heat maps. Dot plots and spectral plots can be set up with live gating. Live gating allows users to find positive and negative populations quickly and easily for added assurance about target populations. Height (Wavelength) Plate and High Content Analysis Import plate or high content screening...
Open the catalog to page 9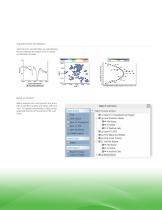
Expanded Data Visualization Spectral, FCS, and CSV files are read directly by the software to enable more in-depth visualization of data. Batch and Report Batch analysis lets users process any number of samples quickly and easily with one click. To support presentation, data can be exported directly to PowerPoint, PDF, and Excel.
Open the catalog to page 10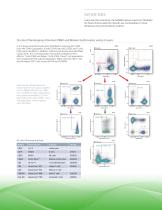
Sample Data Using spectral unmixing, the SA3800 allows maximum flexibility for fluorochrome selection. Results are comparable to those obtained using conventional systems. 10-color Phenotyping of Human TBNK and Mature Erythrocytes using 3 Lasers WLSM In this panel, all lymphocytes were identified by staining with CD45. From the CD45+ population, B cells (CD19), NK cells (CD56), and T cells (CD3) were identified. In addition, mature erythrocytes were identified using CD235. The T-cell population was further analyzed to find effector T cells (CD8) and helper T cells (CD4). These T-cell populations...
Open the catalog to page 11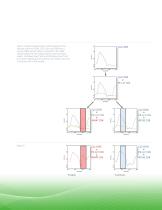
Figure A shows single positive control overlays of the spectral curves for CD45, CD3, CD4, and CD8 from a human TBNK sample. When compared to the TBNK sample (Figure B), the single positive control overlays match. CD4 Alexa Fluor® 647 and CD8 Alexa Fluor® 532 are used to distinguish the presence of T-helper cells and T-cytotoxic cells in the sample. Intensity_H Intensity_H Intensity_H Intensity_H Intensity_H Intensity_H Intensity_H Intensity_H Intensity_H Intensity_H Intensity_H Intensity_H
Open the catalog to page 12All Sony Biotechnology catalogs and technical brochures


- Analysis software
- Design software
- Acquisition software
- Data analysis software
- Cell imaging system
- Automatic cell imaging system
- Laboratory cell imaging system
- Fluorescence cell imaging system
- Thoracic software
- Automatic cytometer
- Benchtop cytometer
- Blood cell cytometer
- Research cell imaging system
- Digital cytometer
- LED fluorescence cell imaging system