- Catalogs
- TMSi systems
- Measuring respiration
Measuring respiration

Measuring respiration
The document discusses the importance of measuring respiration for various medical purposes, such as assessing pulmonary function and detecting apneas. Different requirements for bandwidth, resolution, accuracy, and processing algorithms are necessary depending on the application, which includes sleep analysis, pulmonary function tests, and pediatric monitoring.
Measurement Technologies
Several technologies are used to measure respiration, including inductive, resistive, piezo, thermistor, impedance, pressure, magnetic, optical, and capacitive methods. The document focuses on inductive and resistive technologies, detailing their specifications and applications.
Specifications
- Amplitude: 2 – 200mV
- Frequency waveform: 0 – 150Hz
- Repetition frequency: 0 – 20 per minute for adults, 0 – 100 per minute for neonates
Measurement of Respiration
Inductive belts provide stable signals with large amplitudes and are less affected by movement artifacts. Resistive belts are cheaper and easier to use but more susceptible to noise and movement artifacts. The choice between these technologies depends on the importance of waveform accuracy.
Respiration Signal
Respiration signals can be affected by movement artifacts, making detection challenging. The document describes an algorithm to detect respiration signals by comparing delayed signals with an offset to filter out noise and calculate respiration rates.
Conclusion
The proposed algorithm is robust, independent of DC variations and signal amplitude, and suitable for implementation in embedded software applications. It effectively detects respiration waves and calculates respiration rates, even in the presence of movement artifacts.
Catalog excerpts

Measuring Respiration Measuring respiration Version 2.0 January 2013 Jan Peuscher
Open the catalog to page 1
Measuring Respiration The measurement of the respiration and the calculation of the respiration rate. 1. Introduction For several medical purposes, the respiration of a patient has to be measured. Sometimes we want to have an impression about the pulmonary function, sometimes we just want to detect and calculate the amount of apneas. An apnea is a defined as a minimum period where the patient has stopped breathing. It is even possible to calculate the pulmonary volume out of the respiration signal, but that is a very special measurement and calculation. On account of the different backgrounds...
Open the catalog to page 2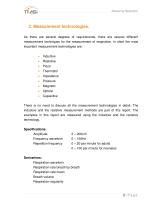
Measuring Respiration 2 - 200mV 0 - 150Hz 0 - 20 per minute for adults 0 - 100 per minute for neonates 2. Measurement technologies. As there are several degrees of requirements, there are several different measurement techniques for the measurement of respiration. In short the most important measurement technologies are: • Inductive • Resistive • Piezo • Thermistor • Impedance • Pressure • Magnetic • Optical • Capacitive There is no need to discuss all the measurement technologies in detail. The inductive and the resistive measurement methods are part of this report. The examples in this report...
Open the catalog to page 3
Measuring Respiration Apneas Obstructive apnea Central apnea Hypopnea Apnea-Hypopnea Index (AHI) Paradoxical breathing Periodic breathing And several correlations between EEG, REM sleep, apneas, quiet sleep, nonquiet sleep and desaturations. 3. The measurement of the respiration If we use an inductive belt for the measurement of the respiration, the result will be a DC and stable respiration signal as shown in figure 1. Figure 1: Respiration signal measured with an inductive belt. In figure 1 you can see a respiration signal including an apnea of about 20 seconds. The respiration is measured...
Open the catalog to page 4
Measuring Respiration A resistive belt is cheaper, and easier in use. The amplitude is not as high as compared with the inductive belt, but high enough to guarantee a good respiration signal. The signal includes more noise, but the noise can be removed by smoothing the signal. The sensitivity to movement artifacts is a little bit higher than the inductive belts. The resistive belt has the disadvantage that all types of movements will cause in a piezo spike wave distortion. This distortion can be filtered out for the biggest part, but on the other hand you can use this distortion to detect for...
Open the catalog to page 5
Measuring Respiration Figure 3: Example of a respiration measurement with a resistive belt. In figure 1 and 3, you can clearly see the difference in the waveform. When a waveform is very important, for instance when the pulmonary breath volume has to be calculated, you have to use an inductive measurement technique. When the waveform is less important, it is easier to use the resistive technology.
Open the catalog to page 6
Measuring Respiration 4. The respiration signal In figure 1 and 3 two nice and smooth respiration signals are shown. Amplitude is very high, up to hundreds of millivolts, and the waveform is easy to interpret. But as is shown in the next picture, the measurement of respiration is often hampered with movement artifacts. Figure 4: Three respiration signals during sleep analysis showing a lot of movement artifacts. The upper trace shows a signal that is measured using a thermistor sensor. This technique is often used when we want to measure the nasal airflow. The middle and lower trace show the...
Open the catalog to page 7
Measuring Respiration Figure 5: The same measurement as shown in Figure 4, now during a period of quiet sleep. Sometimes we can find some very odd respiration waveforms, as is shown in figure 6. Figure 6: Same measurement as in Figures 4 and 5, but here we see an example of periodic breathing. From the given examples it is clear that the detection of the respiration and the calculation of the respiration rate is not as simple as it seems. Waveform detection and the use of a threshold are impossible, because the amplitude and the repetition frequency are not stable during the measurement. In case...
Open the catalog to page 8
Measuring Respiration respiration rates of 6 up to a 100 per minute. Such a filter can show a lot of DC movement artifacts as is shown in figure 6, the nasal flow trace. So the question is how to find the respiration waveform within the large amount of movement artifacts and low frequency noise. Therefore I developed the following detection algorithm. First of all we start with a nice and smooth respiration signal as is shown in figure 7. Figure 7: Stable and undisturbed respiration signal. The first processing step is to delay the signal. The delay time should be large enough to see the differences,...
Open the catalog to page 9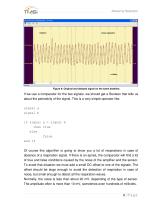
Measuring Respiration Figure 8: Original and delayed signal on the same baseline. If we use a comparator for the two signals, we should get a Boolean that tells us about the periodicity of the signal. This is a very simple operator like: signal a signal b if signal a > signal b then true else false end if Of course this algorithm is going to show you a lot of respirations in case of absence of a respiration signal. If there is an apnea, the comparator will find a lot of true and false conditions caused by the noise of the amplifier and the sensor. To avoid that situation we must add a small DC...
Open the catalog to page 10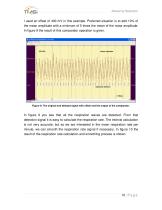
Measuring Respiration I used an offset of 400 mV in this example. Preferred situation is to add 10% of the mean amplitude with a minimum of 5 times the mean of the noise amplitude. In figure 9 the result of this comparator operation is given. Figure 9: The original and delayed signal with offset and the output of the comparator. In figure 9 you see that all the respiration waves are detected. From that detection signal it is easy to calculate the respiration rate. The interval calculation is not very accurate, but as we are interested in the mean respiration rate per minute, we can smooth the...
Open the catalog to page 11
Measuring Respiration Figure 10: Respiration rate calculation during a 30 minutes measurement. For the detection and calculation of apneas and periodic or paradoxical breathing, we have to use the Boolean output signal of the comparator. Using this algorithm for the detection of apneas and periodic breathing, we get the signal as is shown in figure 11. Figure 11: Respiration detection during quiet sleep and periodic breathing. You see that all the respiration waves during quiet sleep are detected without any problem. 11 | P a g e
Open the catalog to page 12All TMSi systems catalogs and technical brochures


- Analysis software
- Visualization software
- ECG cable
- Straight electrode
- Monitoring sensor
- Acquisition software
- Electrophysiological exploration electrode
- Import software
- Sharing software
- EMG electrode
- Electrophysiology amplifier
- Medical web application
- EEG electrophysiology amplifier
- 32-channel electrophysiology amplifier
- EMG electrophysiology amplifier
- Electrophysiology software
- 64-channel electrophysiology amplifier
- Cutaneous electrode
- Tablet PC web application
- Windows web application