
Excertos do catálogo
Optical Emission Spectrometer
Abrir o catálogo na página 1
A New Design of Spectrometer with Higher Stability High accuracy and stability measurement achieved by the latest optical design A Novel Excitation Unit Equipped with real-time energy monitoring Sophisticated Software Total support for control and management of the instrument with an intuitive interface A New Design of Spectrometer with Higher Stability A Novel Excitation Unit Shimadzu's Unique Pulse Distribution Analysis Photometry Intuitive Software PDA-R Automatic Analysis System Specifications, Installation and Optional Accessories
Abrir o catálogo na página 3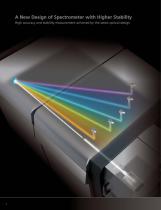
A New Design of Spectrometer with Higher Stability High accuracy and stability measurement achieved by the latest optical design
Abrir o catálogo na página 4
More Precise Analysis Achieved with a High-Resolution Spectrometer Using a Paschen-Runge Spectrometer with the focal length of 1000mm, and a diffraction grating suitable for each of ferrous or non-ferrous application, PDA-8000 offers high-resolution measurements with less spectral interference over a wide wavelength range. Stable and Proven Vacuum Spectrometer Oxygen inside the spectrometer needs to be removed because it absorbs spectral lines in the vacuum-ultraviolet wavelength range, and some important elements in material analysis have spectral lines in this range, including Phosphorus,...
Abrir o catálogo na página 5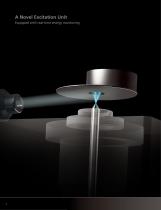
A Novel Excitation Unit Equipped with real-time energy monitoring
Abrir o catálogo na página 6
Constant Monitoring of the Discharge Status A Realtime Energy Monitoring* function is provided to monitor the discharge energy consumed between the counter electrode and the sample. The discharge energy is accurately set and controlled, and discharge defects due to the surface condition of the sample can be instantly detected from the discharge energy. The accuracy is improved by eliminating samples with defects from the measurement. *Patent pending Discharge defect Real-time energy monitoring Supporting Diverse Metal Materials Many metal materials can be analyzed over a wide range of...
Abrir o catálogo na página 7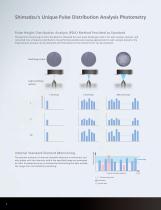
Shimadzu's Unique Pulse Distribution Analysis Photometry Pulse Height Distribution Analysis (PDA) Method Provided as Standard The spectral intensity signal from the detector obtained for each pulse discharge is fed in for each analysis element, and converted into a frequency distribution. By performing statistical processing appropriate for each analysis element, the measurement accuracy can be improved and information on the element form can be extracted. Discharge crater Light emitting section Spectral intensity The spectral intensity of internal standard elements is monitored, and only...
Abrir o catálogo na página 8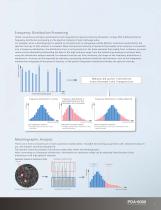
Frequency Distribution Processing Unlike conventional emission spectrometry that integrates the spectral intensity, Shimadzu's unique PDA method performs frequency distribution processing on the spectral intensity of each discharge pulse. For example, when a discharge spot is applied to inclusions such as manganese sulfide (MnS) or aluminum oxide (Al2O3), the spectral intensity of that element is increased. When the spectral intensity of elements that readily form inclusions is converted into a frequency distribution, the distribution form is not symmetrical. For these elements that readily...
Abrir o catálogo na página 9
Intuitive Software PDA-R Total support for control and management of the instrument with an intuitive interface Fusion of Hardware and Software From control and diagnosis to maintenance—reliable instrument management with software integrated with the hardware. The operating time of each part is controlled by each unit, so there is no problem when replacing PCs. Of course, they can be easily checked with the software. The software supports complete maintenance management for stable use of the instrument. • Lens cleaning procedure • Pump oil replacement • Electrode replacement • Entrance slit...
Abrir o catálogo na página 10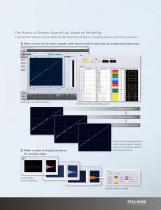
The Pursuit of Greater Ease-of-Use, Based on Reliability A sophisticated, operator-friendly design has been developed utilizing our cumulative emission spectrometry experience. Plots can be set for each sample, with more intuitive and easy-to-understand operation Working curve setting screen Working curve plot setting screen Before correction Matrix element correction Wide variety of display patterns for analysis data Plots can be distinguished for each sample type to visually check the correction status of the working curves. Analysis data control diagrams Display pattern setting
Abrir o catálogo na página 11
Electrode-Cleaning Unit Automatic sample retainer mechanism To enhance long-term stability, the optional electrode-cleaning unit keeps the counter electrode clean by brushing away adhering sample deposits. Used to reduce the effect of the heat energy generated by high-energy discharge. A separate cooling water circulator is necessary. Cooling Water Circulator (P/N 044-01809-10) Handles samples between 3 mm and 12 mm in diameter. more more more more more more more (1) Emission table (2) Insulating washer (3) Mylar * When ordering multiple parts at the same time or adding to the existing...
Abrir o catálogo na página 12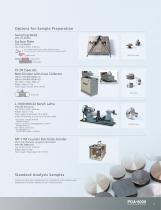
Options for Sample Preparation Sampling Mold (P/N 210-00005) Pour molten metal from a cupola, electric furnace, or low-frequency induction furnace into the sampling mold. Molten metal Mushroom type Sampling mold Surface plate FS-3N (Special) Belt Grinder with Dust Collector (50 Hz: P/N 085-50206-15) (60 Hz: P/N 085-50206-16) Size: W441 × D680 × H883 mm Weight: Approx. 97 kg Power Supply: 3-phase 200 V 1150 W Disk type Belt grinder Size: W770 × D420 × H350 mm Weight: Approx. 75 kg Power Supply: Single phase 100 V 300 W Order the following 1) and 2) with the bench lathe. 1)Tip holder...
Abrir o catálogo na página 13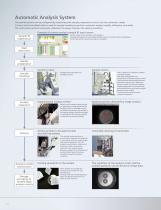
Automatic Analysis System The optimal system can be configured by combining with sample preparation units to suit the customers' needs. A 6-axis multi-articulated robot is used for sample handling to perform automatic analysis rapidly, efficiently, and safely. The instrument performs automatic calibration to always maintain the optimal condition. Example of process analysis sample ID input screen Set the sample ID in accordance with guidance. The processing status of each analysis sample and the instrument status are displayed. The PC type and the touch panel type are available. Start...
Abrir o catálogo na página 14Todos os catálogos e folhetos técnicos Shimadzu
-
 RADspeed Pro EDGE
5 Páginas
-
 UV-1900i
4 Páginas
-
 LCMS-9030
12 Páginas
-
 LCMS-8050
20 Páginas
-
 LCMS-8045
12 Páginas
-
 XRD-6100
32 Páginas
-
 EDX-LE
16 Páginas
-
 AA-6200
12 Páginas
-
 UV-3600i Plus
20 Páginas
-
 SPM-9700HT
27 Páginas
-
 SALD-2300
20 Páginas
-
 IG-1000 Plus
16 Páginas
-
 DSC-60 Plus Series
8 Páginas
-
 TOC process analysis
16 Páginas
-
 MB140
MB1404 Páginas
-
 Shimadzu Super-Clean Gas Filter
4 Páginas
-
 GC Column Guidebook
48 Páginas
-
 ATX/ATY Series
6 Páginas
-
 MOC63u
2 Páginas
-
 MOC-120H
4 Páginas
-
 MOC63u
8 Páginas
-
 UW/UX Series
4 Páginas
-
 Application Handbook Clinical
140 Páginas
-
 New products 1
1 Páginas
-
 New products
1 Páginas
-
 Development of the OPESCOPE ACTENO
3 Páginas
-
 BL series
2 Páginas
-
 BW-K/BX-K
2 Páginas
-
 TX/TXB/TXC Series
8 Páginas
-
 HMV- 2 brochure
8 Páginas
-
 AutographA G - XSeries
20 Páginas
-
 Solutions Brochure
24 Páginas
-
 PSSM - 8 System
8 Páginas
-
 MOC-120H
4 Páginas
-
 AUW-D / AUW / AUX / AUY
8 Páginas


Catálogos arquivados
-
 MOC63U Flyer
2 Páginas
-
 ATX/ATY Series_2013
4 Páginas
-
 UW/UX Series
4 Páginas
-
 SALD-7101
16 Páginas
-
 MOC63U
6 Páginas